This guide covers how IOPS and throughput are defined, how they scale with disk size, where the hard ceilings are, how to measure actual consumption, and the mistakes teams make most often when reading the limits.
Key Takeaways
- Every Premium SSD v2 disk includes 3,000 IOPS and 125 MB/s free, regardless of size
- Maximum per-disk limits are 80,000 IOPS and 2,000 MB/s — reaching them requires at least 160 GiB and a compatible VM
- Performance can be adjusted up to four times per 24-hour window without downtime; propagation takes up to an hour
- Premium SSD v2 cannot be used as an OS disk and has no host caching, which limits certain deployment patterns
What IOPS and Throughput Mean in Azure Premium SSD v2
IOPS (input/output operations per second) is the count of discrete read and write requests the disk services each second. Throughput (MB/s) is the volume of data moved per second. They're related but independent: Throughput = IOPS × I/O block size. A workload doing large sequential reads can saturate throughput while barely touching IOPS. A workload doing many small random reads can max out IOPS while throughput stays low.
How Premium SSD v2 Differs from v1
Premium SSD v1 bundles performance with disk size — you buy a P30 and get whatever IOPS and throughput that tier includes. Premium SSD v2 separates the three dimensions entirely. Capacity, IOPS, and throughput are provisioned independently. A 100 GiB disk can carry 20,000 IOPS without buying a larger disk to unlock that ceiling.
In practice, this means you can right-size each dimension independently — paying for the capacity your data needs and the performance your workload demands, not whichever tier bundles both closest together.
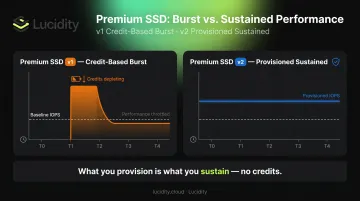
Provisioned, Not Burst
IOPS and throughput on Premium SSD v2 are provisioned sustained values, not burst allowances backed by a credit pool. The disk is designed to deliver those numbers 99.9% of the time. There is no credit balance to exhaust.
Teams migrating from Premium SSD v1 often expect burst headroom to cover demand spikes. That model doesn't apply here — what you provision is what you get, continuously.
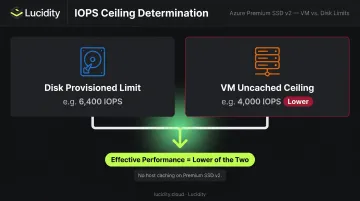
The VM Ceiling That Gets Overlooked
Provisioning the right disk values is only half the equation. The VM the disk attaches to carries its own uncached disk IOPS and throughput ceiling, and effective performance is capped by whichever limit is lower — disk or VM.
Key implications of the VM ceiling:
- Every read and write counts against both the disk's provisioned limits and the VM's uncached ceiling
- There is no host caching on Premium SSD v2 to absorb read traffic, unlike Premium SSD v1
- Undersizing the VM SKU can bottleneck a correctly provisioned disk entirely
Per Microsoft's disk performance documentation, whichever limit — disk or VM — is lower constrains the workload. Check both before assuming a provisioning change will resolve a performance issue.
IOPS and Throughput Scaling: The Full Performance Range
The Baseline and How It Grows
All Premium SSD v2 disks start with 3,000 IOPS and 125 MB/s included at no extra charge. That's the floor. What you can provision above that floor is determined by disk size.
IOPS scaling rule: After 6 GiB, maximum settable IOPS increases by 500 IOPS per GiB.
| Disk Size | Max Configurable IOPS |
|---|---|
| 6 GiB | 3,000 (baseline) |
| 8 GiB | 4,000 |
| 10 GiB | 5,000 |
| 160 GiB | 80,000 |
The 80,000 IOPS ceiling requires a minimum disk size of 160 GiB. You cannot configure 80,000 IOPS on a 50 GiB disk — the size gates the maximum.
Throughput Scaling Depends on Provisioned IOPS
Throughput scales off provisioned IOPS using a fixed multiplier:
Max throughput = provisioned IOPS × 0.25 MB/s
Worked example:
- Disk provisioned at 3,000 IOPS → max throughput = 750 MB/s
- Disk provisioned at 5,000 IOPS → max throughput = 1,250 MB/s
- To reach 2,000 MB/s, the disk must be provisioned to at least 8,000 IOPS (8,000 × 0.25 = 2,000)
Per Microsoft's managed disk types documentation, 2,000 MB/s is the absolute throughput ceiling for Premium SSD v2 — reached only when provisioned IOPS hit 8,000 or above. A disk provisioned at 5,000 IOPS caps out at 1,250 MB/s, not 2,000 MB/s.
Performance Adjustment Limits
IOPS and throughput adjustments come with operational constraints worth planning around:
- Changes are capped at four per 24-hour rolling window — disk creation counts as one
- That leaves only three adjustments available in the first 24 hours after provisioning
- Propagation takes up to one hour, making reactive scaling during a live incident unreliable
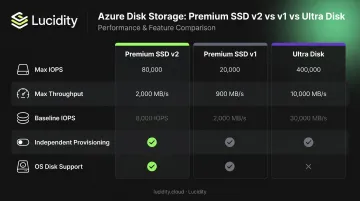
Premium SSD v2 vs. v1 vs. Ultra Disk
| Disk Type | Max IOPS | Max Throughput | Baseline IOPS | Size Range | Independent Provisioning | OS Disk |
|---|---|---|---|---|---|---|
| Premium SSD v2 | 80,000 | 2,000 MB/s | 3,000 included | 1 GiB–64 TiB | Yes | No |
| Premium SSD v1 | 20,000 | 900 MB/s | Tier-dependent | 4 GiB–32,767 GiB | No | Yes |
| Ultra Disk | 400,000 | 10,000 MB/s | 100 IOPS min | 4 GiB–64 TiB | Yes | No |
Key Properties That Govern Real-World Behavior
Latency and Background Operations
Premium SSD v2 targets sub-millisecond latency 99.9% of the time under normal operation. The exception: background control-plane operations — disk resize, detach/reattach, storage type changes — can temporarily elevate read latency. For 4K sector-size disks, only reads are affected during these periods. For 512E sector-size disks, both reads and writes can see elevated latency.
Sector Size and I/O Alignment
Premium SSD v2 defaults to 4K physical sector size but can be configured for 512E (512-byte emulation). I/O misalignment — where application block sizes don't align with the disk's sector size — silently degrades effective IOPS and throughput without triggering throttling or any error — you simply get less performance than you provisioned.
One concrete compatibility note to keep in mind:
- Oracle Database: Requires release 12.2 or later for 4K native disks — older releases need 512E configuration
Regional and Zonal Availability
Beyond performance properties, deployment topology also constrains where Premium SSD v2 can run. It is only available in specific Azure regions, and within those regions, it can only be attached to **VMs deployed in an availability zone**. A VM without a zone assignment cannot use Premium SSD v2. This constraint affects:
- Multi-region deployment designs where some regions lack zone support
- Non-zonal VM deployments that would need restructuring to adopt Premium SSD v2
- Availability set deployments, which require a separate workaround
If your current architecture uses non-zonal VMs or availability sets, account for that restructuring cost before treating Premium SSD v2 as a drop-in upgrade.
How to Measure and Validate IOPS and Throughput Consumption
Azure Monitor: Start Here
Azure Monitor exposes two percentage metrics that matter most for right-sizing:
- Data Disk IOPS Consumed Percentage — what fraction of provisioned IOPS the disk is using per minute
- Data Disk Bandwidth Consumed Percentage — what fraction of provisioned throughput is consumed per minute
Consistently hitting 90%+ on either metric means the provisioned limit is the active constraint. The percentage metrics are more actionable than absolute read/write counters because they normalize consumption against the actual provisioned ceiling — knowing you're doing 8,000 IOPS is less useful than knowing that's 80% of what you provisioned.
For absolute load visibility, Azure Monitor also exposes Data Disk Read Operations/Sec, Data Disk Write Operations/Sec, Data Disk Read Bytes/Sec, and Data Disk Write Bytes/Sec at the VM level, and parallel metrics at the disk resource level.
OS-Level Tools for Deeper Diagnostics
Azure Monitor tells you that a limit is being hit. OS-level tools tell you what is hitting it, with per-request granularity:
- Linux:
iostatreportsr/s,w/s, andawait(average I/O latency including queue time) - Windows: PerfMon counters
Disk Reads/sec,Disk Writes/sec, andAvg. Disk sec/Readexpose the same dimensions
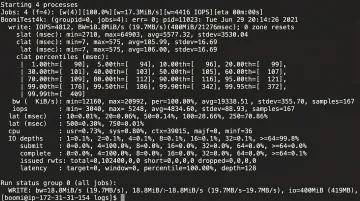
For controlled benchmarking that isolates disk performance from application variability, Microsoft recommends FIO on Linux and DiskSpd on Windows. Both tools let you define block size, queue depth, and read/write mix to validate that field performance matches what the provisioning spec should deliver.
Managing Scale with Lucidity Lumen
Azure Monitor works well for individual disks. At scale (dozens or hundreds of Premium SSD v2 volumes across an environment), per-disk queries become operationally heavy.
Lucidity Lumen continuously tracks IOPS, throughput, latency, and cost across every disk in the estate. It classifies disks into four idle categories — unattached, reserved, unmounted, and zero-I/O — surfacing disks that are provisioned with high IOPS but processing no actual I/O.
A zero-I/O Premium SSD v2 disk provisioned at 40,000 IOPS generates hourly charges for performance no workload is consuming. Lumen backs every recommendation with historical usage trends rather than point-in-time snapshots, so right-sizing decisions reflect actual patterns rather than outlier moments.
What Happens When You Exceed Performance Limits
Throttling Behavior
When demand exceeds either the disk's provisioned limit or the VM's uncached ceiling, Azure caps performance rather than returning I/O errors. The result is elevated latency and reduced effective IOPS — symptoms that look like application slowness rather than a clear infrastructure failure. This is what makes throttling harder to diagnose than an outright error.
The VM Ceiling in Practice
A Premium SSD v2 disk provisioned at 80,000 IOPS does nothing for you if the attached VM can't sustain that workload. The Standard_D8s_v5, a commonly used general-purpose VM, has an uncached Premium SSD IOPS limit of 12,800 IOPS and 290 MB/s throughput. Attaching an 80,000-IOPS disk to that VM doesn't change the effective ceiling — the VM is the constraint.
The correct fix in that scenario is upsizing the VM, not the disk. The Standard_D16s_v5 raises those limits to 25,600 IOPS and 600 MB/s. Both need to be sized together — provisioning mismatches in either direction leave performance on the table.
Cost of Over-Provisioning
That's the under-provisioning scenario. Over-provisioning flips the problem: no performance issues, just unnecessary spend.
Premium SSD v2 billing is hourly, charged on provisioned IOPS above the 3,000 baseline. The cost difference compounds quickly:
| Provisioned IOPS | Billable Units Above Baseline | Relative IOPS Spend |
|---|---|---|
| 10,000 | 7,000 | 1× |
| 80,000 | 77,000 | 11× more |
If the workload never needed that headroom, the 80,000-IOPS disk is pure waste. For current per-region pricing, see the Azure Managed Disks pricing page.
Common Misconceptions About Premium SSD v2 Limits
"3,000 IOPS Is the Guaranteed Floor"
It's the disk-level specification — but smaller VM sizes have uncached IOPS limits below 3,000. Validate that your VM can actually deliver the disk baseline before assuming it's reachable.
"I Can Adjust IOPS in Real Time During an Incident"
The four-change-per-24-hour limit and up-to-one-hour propagation delay make reactive scaling during an incident unreliable. Provisioning decisions need to anticipate demand, not react to it.
"Premium SSD v2 Bursts Like v1 Did"
It doesn't. Premium SSD v2 has no credit-based burst mechanism — what you provision is what you sustain. This distinction matters most for teams migrating from v1:
- Over-reliance on burst headroom to absorb peak workloads won't carry over
- Peak demand must be explicitly provisioned upfront, not covered by burst credits
- Sizing assumptions built around v1 behavior will likely result in underprovisioned disks
Frequently Asked Questions
What is the performance of Azure Premium SSD v2?
Every disk includes a free baseline of 3,000 IOPS and 125 MB/s. Maximum configurable limits are 80,000 IOPS and 2,000 MB/s per disk. The disk is designed to sustain provisioned performance with sub-millisecond latency 99.9% of the time.
What are the limitations of Azure Premium SSD v2?
Premium SSD v2 cannot be used as an OS disk and must be attached as a data disk only. It has no host caching, is only available in specific Azure regions, requires a zonal VM, and allows a maximum of four performance changes per 24-hour window.
What is the baseline IOPS for Azure Premium SSD v2?
All Premium SSD v2 disks include 3,000 IOPS and 125 MB/s throughput at no additional charge, regardless of disk size. Provisioned IOPS above 3,000 are billed separately at an hourly rate.
Can Azure Premium SSD v2 be used as an OS disk?
No. Premium SSD v2 is a data disk only. For data volumes, pair it with a Premium SSD or Standard SSD for the OS disk.
How often can I change the IOPS and throughput on a Premium SSD v2?
Up to four times in any 24-hour rolling window. Disk creation counts as one adjustment, leaving three remaining changes in the first 24 hours. Changes can take up to one hour to take effect.
How does Premium SSD v2 compare to Ultra Disk for high-IOPS workloads?
Ultra Disk supports up to 400,000 IOPS versus 80,000 for Premium SSD v2, making it the right choice for extreme workloads like SAP HANA. Premium SSD v2 covers the majority of production database and analytics workloads at a lower price point and with broader VM compatibility.