Introduction
Teams running workloads on Azure regularly hit sluggish databases, slow application response times, and latency spikes — and when they dig in, misconfigured disk IOPS is usually the culprit. The frustrating part: the root cause is rarely obvious. A disk upgrade that should have fixed things doesn't move the needle. A VM resize helps but doesn't fully resolve the problem.
Azure disk IOPS don't operate as a simple dial you turn up or down. Performance flows through three distinct provisioning layers, and a ceiling at any one of them caps your total throughput regardless of what you've configured elsewhere.
This post covers how IOPS are actually allocated across the Azure VM-disk stack, what causes bottlenecks at each layer, and practical steps to optimize performance without over-spending.
Key Takeaways
- Azure IOPS are constrained by three layers — disk tier, VM tier, and host cache — and the tightest limit always applies
- Each disk type has hard IOPS maximums: Ultra Disk (400,000), Premium SSD v2 (80,000), Premium SSD (20,000), Standard SSD (6,000), Standard HDD (2,000–3,000)
- VM-level and disk-level IOPS caps are independent; raising one without the other leaves the bottleneck in place
- Host caching can meaningfully raise your effective IOPS ceiling without changing disk type
- Over-provisioned IOPS is a real cost driver — continuous monitoring and right-sizing are essential
How Azure Managed Disk IOPS Work: The Three-Layer Architecture
I/O doesn't travel directly from your application to the managed disk. It traverses up to three distinct provisioning layers in Azure, and your effective performance is capped by whichever layer has the lowest limit, no matter what you've provisioned at the other layers.
The Uncached (Remote) Disk Path
When host caching is disabled (set to "None"), I/O runs through two constraints in sequence:
- Disk-level IOPS limit — the provisioned ceiling for the attached managed disk
- VM uncached IOPS limit — the VM's remote storage network bandwidth cap
This is the default path for most data disks. Both limits apply, and either one can be the bottleneck.
The Cached Disk Path and Host SSD
When host caching is enabled, a local SSD close to the VM acts as an intermediate cache layer with its own IOPS and throughput budget.
Cache hit behavior: I/O is served from the host SSD and counts only against the VM's cached IOPS limit — the remote disk isn't involved.
Cache miss behavior: I/O is relayed to the disk and counts against both the cached and uncached limits simultaneously. Writes also follow this path, regardless of cache mode.
Two caching modes are available:
- Read-Only — best for read-heavy workloads (frequent data scans, static content). Writes bypass the cache entirely and count against uncached limits.
- Read/Write — suited for mixed workloads. Writes go to cache first and are lazily flushed to disk, reducing uncached I/O consumption.
Note: Ultra Disk and Premium SSD v2 do not support host caching.
Combined Cached and Uncached Limits
Understanding each path individually leads to an important insight: both budgets can be drawn on simultaneously.
Microsoft's disk performance documentation confirms that cached and uncached limits are additive — a VM can simultaneously serve cached IOPS from the host SSD and uncached IOPS from remote disks.
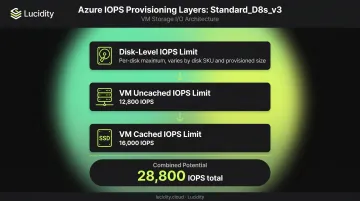
Worked example — Standard_D8s_v3:
| Limit Type | IOPS |
|---|---|
| Cached IOPS limit | 16,000 |
| Uncached IOPS limit | 12,800 |
| Combined potential | 28,800 |
If this VM has two OS/boot disks using Read-Only caching and three data disks with no caching, it can simultaneously draw up to 16,000 IOPS from the cached path and 12,800 from the uncached path. That full 28,800 IOPS is only achievable when the attached disks are provisioned to support it.
IOPS Limits by Disk Type: Choosing the Right Tier
Maximum IOPS by Disk Type
| Disk Type | Max IOPS | OS Disk Support | Host Caching |
|---|---|---|---|
| Ultra Disk | 400,000 | No | No |
| Premium SSD v2 | 80,000 | No | No |
| Premium SSD | 20,000 | Yes | Yes |
| Standard SSD | 6,000 (with Performance Plus) | Yes | Yes |
| Standard HDD | 2,000–3,000 | Yes | Yes |
Ultra Disk and Premium SSD v2 let you provision IOPS independently of disk size — a 160 GiB Premium SSD v2 can be configured for 80,000 IOPS. Premium SSD ties IOPS to provisioned capacity, so you can't get more IOPS without buying a larger disk.
Premium SSD IOPS by Tier
Per Microsoft's scalability targets:
| Tier | Size (GiB) | Base IOPS |
|---|---|---|
| P10 | 128 | 500 |
| P15 | 256 | 1,100 |
| P20 | 512 | 2,300 |
| P30 | 1,024 | 5,000 |
| P40 | 2,048 | 7,500 |
| P50 | 4,096 | 7,500 |
| P60 | 8,192 | 16,000 |
| P80 | 32,767 | 20,000 |
These base IOPS figures represent steady-state performance. For workloads with occasional spikes, Premium SSD also supports temporary bursting — though it's no substitute for selecting the right tier upfront.
A Note on Disk Bursting
Premium SSDs support temporary IOPS bursting — useful for occasional spikes, but not a substitute for correct tier selection:
- P1–P20: Credit-based bursting up to 3,500 IOPS for up to 30 minutes
- P30+: On-demand bursting up to 30,000 IOPS with no duration limit (requires enabling; incurs additional charges)
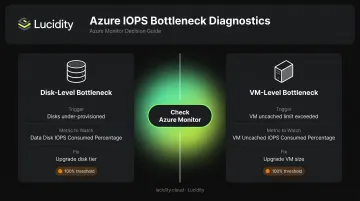
What Causes IOPS Bottlenecks
IOPS bottlenecks come from two distinct layers — disk-level and VM-level — and both can be active at the same time. Most teams only catch one.
Disk-Level IOPS Capping
Scenario: Standard_D8s_v3 VM (12,800 uncached IOPS) with three E30 Standard SSD data disks at 500 IOPS each.
An application requesting 10,000 IOPS receives only 1,500 IOPS — because each disk caps at 500 IOPS. The VM's 12,800 uncached limit is never the constraint.
The fix: Attach higher-tier disks. Resizing the VM accomplishes nothing here.
VM-Level IOPS Capping
Scenario: Same Standard_D8s_v3 VM with three P30 Premium SSD data disks at 5,000 IOPS each (15,000 IOPS potential).
An application requesting 15,000 IOPS is capped at 12,800 IOPS — because the VM's uncached limit is the binding constraint, even though disks have headroom to spare.
The fix: Upgrade the VM size. Swapping in faster disks won't move the needle when the VM itself is the ceiling.
The Hidden Mismatch Trap
These two caps interact in ways that make diagnosis harder than it looks. Teams frequently upgrade disk tier (Standard SSD → Premium SSD) expecting a performance gain, but if the VM was already the bottleneck, nothing improves. The reverse is equally common: a VM upgrade that doesn't resolve disk-level saturation.
Before making any changes, use Azure Monitor to identify which layer is actually constraining you:
Data Disk IOPS Consumed Percentage— disk-level saturationVM Uncached IOPS Consumed Percentage— VM remote storage bottleneckVM Cached IOPS Consumed Percentage— VM cached path bottleneck
When any of these metrics approaches 100%, you've found your bottleneck.
How to Optimize Azure Managed Disk IOPS for VM Performance
Match Disk Tier to Workload Requirements
Not every workload needs Premium SSD. Defaulting to it across all workloads is one of the most common sources of systematic over-provisioning.
| Workload Type | Recommended Disk Tier |
|---|---|
| SAP HANA, high-transaction databases, real-time analytics | Ultra Disk or Premium SSD v2 |
| Production apps with consistent moderate IOPS | Premium SSD |
| Web servers, dev/test environments | Standard SSD |
Align VM Size with Disk IOPS Potential
Every VM size has documented cached and uncached IOPS limits — check both against the aggregate potential of all attached disks. The Dsv3 series documentation provides explicit cached and uncached columns, making it straightforward to verify headroom.
If total disk IOPS potential exceeds the VM's uncached limit, you have two options: upgrade to a larger VM size with a higher uncached limit, or enable host caching to access the cached path's higher limit (where supported).
Enable Host Caching Strategically
| Workload Profile | Recommended Cache Setting |
|---|---|
| Read-heavy (database scans, static content) | Read-Only |
| Mixed workloads with acceptable write-back latency | Read/Write |
| Random large writes, cross-host consistency required | None (disabled) |
| Ultra Disk or Premium SSD v2 | Not supported — disable |
Consider Premium SSD v2 for Flexible IOPS Provisioning
Premium SSD v2 decouples IOPS from disk size. The baseline includes 3,000 IOPS free, with additional IOPS provisioned at 500 IOPS per GiB up to 80,000. With Premium SSD v2, you no longer need to upsize a disk just to unlock more IOPS.
According to FinOps Foundation research, a comparable 1 TB, 5,000 IOPS, 200 MB/s configuration costs approximately $167 with P30 Premium SSD versus $137 with Premium SSD v2 — an 18% reduction. For 10,000 IOPS at the same capacity and throughput, Premium SSD v2 costs only 4% more than a standard P30.
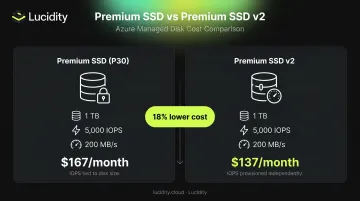
The tradeoff: Premium SSD v2 cannot be used as an OS disk and doesn't support host caching.
Monitoring IOPS and Avoiding Over-Provisioning
The Provisioned vs. Utilized Gap
Over-provisioned IOPS cost money whether you use them or not. Premium SSD bills at a fixed tier tied to disk size; Premium SSD v2 charges for provisioned IOPS above baseline. Either way, a disk provisioned for 5,000 IOPS that consistently consumes 400 represents real waste.
The FinOps Foundation's Usage Optimization framework identifies provisioned-vs-utilized IOPS analysis as a key optimization lever for Azure managed disks.
The Monitoring Workflow
Use Azure Monitor to track IOPS consumption over a 30–90 day window — long enough to capture workload seasonality and backup cycles. Key signals:
- Average daily IOPS utilization — disks consistently far below their provisioned ceiling are candidates for downsizing
- Peak IOPS — a disk that spikes during nightly backups may still justify its tier even if average utilization looks low
- Consumed percentage metrics —
Data Disk IOPS Consumed PercentageandOS Disk IOPS Consumed Percentageshow how close each disk is running to its limit
Scaling This Across Hundreds of Disks
Manual metric queries work for a handful of disks. At enterprise scale — hundreds of disks across multiple Azure subscriptions — the overhead becomes prohibitive.
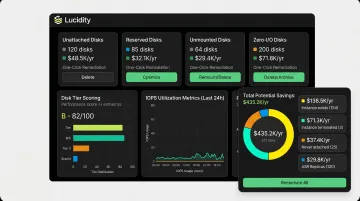
Lucidity's Lumen product addresses this directly. It continuously scores every disk's tier against actual IOPS, throughput, latency, and cost, backed by historical trends rather than point-in-time snapshots. Recommendations are evidence-based: when a disk belongs on a different tier, Lumen shows why, quantifies the savings, and can execute the change in one click, with no maintenance window required.
Where Lumen goes further is idle disk detection. Most tools catch unattached disks; Lumen identifies all four categories: unattached, reserved, unmounted, and zero-I/O. Zero-I/O disks (volumes attached to running instances but generating no I/O activity) don't appear in native Azure dashboards or standard Advisor recommendations.
Together, these four idle disk categories can represent up to 70% of unused block storage spend. For enterprises managing large Azure environments, that continuous coverage translates directly to reclaimed engineering hours and measurable cost reduction each quarter.
Frequently Asked Questions
What is the maximum IOPS for Azure managed disks?
Maximum IOPS depends on disk type. Per Microsoft's documentation, Ultra Disk supports up to 400,000 IOPS, Premium SSD v2 up to 80,000, Premium SSD up to 20,000, Standard SSD up to 6,000, and Standard HDD up to 2,000–3,000. Keep in mind that the VM's own IOPS limit may cap effective throughput before the disk limit is reached.
What is the performance of Azure managed disks?
Disk performance is defined by IOPS, throughput (MB/s), and latency — all varying by disk type and size tier. Ultra Disk and Premium SSD v2 are designed for sub-millisecond latency; Premium SSD delivers single-digit millisecond latency 99.9% of the time; Standard SSD delivers single-digit millisecond latency 99% of the time.
What is the difference between cached and uncached IOPS limits in Azure?
Cached IOPS limits apply when host caching is enabled and I/O is served from the local SSD near the VM. Uncached IOPS limits govern I/O flowing directly to remote managed disk storage. VMs supporting premium storage have separate cached limits (typically higher than uncached), allowing combined throughput when both path types are active.
How do I check if my Azure VM is being throttled on IOPS?
Check Azure Monitor for VM Uncached IOPS Consumed Percentage and VM Cached IOPS Consumed Percentage to detect VM-level throttling. For disk-level throttling, watch Data Disk IOPS Consumed Percentage. When any of these metrics approach or sustain 100%, throttling is active and performance will degrade.
Can I increase IOPS on an Azure managed disk without downtime?
Ultra Disk and Premium SSD v2 support runtime IOPS adjustments without detaching the disk or restarting the VM. Changes take up to one hour and are limited to four adjustments per 24-hour window. For Premium SSD, a higher-tier upgrade may require a disk resize, which is supported online for most scenarios.