Unlike Premium SSD v1, where performance is locked to disk size (a P30 gives you exactly 5,000 IOPS and 200 MB/s, full stop), Premium SSD v2 lets you provision IOPS and throughput independently from capacity. That flexibility is genuinely useful — but it comes with scaling formulas, coupling constraints, and adjustment quotas that engineers need to understand before provisioning.
This article breaks down exactly how IOPS and throughput limits work: the baseline values, the scaling math, the relationship between the two dimensions, what throttling actually looks like, and the configuration mistakes that lead to either performance problems or wasted spend.
Key Takeaways
- Every Premium SSD v2 disk includes 3,000 IOPS and 125 MB/s throughput at no additional charge, regardless of size.
- Maximum provisionable IOPS is 80,000; maximum throughput is 2,000 MB/s, both bounded by disk size and IOPS provisioning rather than freely configurable.
- Throughput scales at 0.25 MB/s per provisioned IOPS — provision IOPS first, or throughput will be the bottleneck.
- You can adjust performance settings up to four times per 24-hour window, including disk creation.
- Disk limits only matter if your VM can match them — check VM-level I/O caps before assuming the disk is the constraint.
What IOPS and Throughput Actually Mean in Premium SSD v2
IOPS (Input/Output Operations Per Second) measures how many discrete read/write operations a disk handles per second. Throughput (MB/s) measures total data volume transferred per second. In Premium SSD v2, both are provisioned limits you declare at disk creation — not burst ceilings or rough estimates. Microsoft guarantees these provisioned values 99.9% of the time.
This is a meaningful departure from Premium SSD v1. With v1, choosing a disk tier locks both values together — a P30 is always 5,000 IOPS and 200 MB/s. Premium SSD v2 decouples performance from capacity. You set exactly what you need via --disk-iops-read-write and --disk-mbps-read-write at creation, and Azure enforces those as hard limits.
When a workload hits those limits, Azure throttles — it does not degrade gracefully. Excess I/O requests are queued or dropped, latency climbs, and the application feels it immediately.
IOPS vs. Throughput: Which Limit Gets Hit First?
The answer depends entirely on workload I/O profile:
- OLTP databases (small, random reads/writes at 4–16 KB block sizes): consume IOPS rapidly while barely touching throughput capacity
- Analytics or data warehouse workloads (large sequential reads at 256 KB+ block sizes): saturate throughput long before IOPS becomes a constraint
- Mixed workloads: both dimensions matter, and you need to size for the worst-case combination
Sizing only one dimension and ignoring the other is a common miscalculation. A workload can look healthy on IOPS while quietly saturating throughput — or vice versa — driving latency spikes that are difficult to diagnose after the fact.
How IOPS and Throughput Scale with Disk Size
While IOPS and throughput are independently settable, the maximum values you can provision are bounded by disk capacity. Larger disks unlock higher performance ceilings.
Baseline: What You Get for Free
Every Premium SSD v2 disk — regardless of size — includes:
- 3,000 IOPS at no additional charge
- 125 MB/s throughput at no additional charge
Provisioning above these baselines incurs incremental cost, billed as separate line items: per provisioned IOPS above 3,000, and per provisioned MB/s above 125. Disk capacity is billed per GiB independently. Check the Azure Managed Disks pricing page for current per-unit rates.
IOPS Scaling Formula
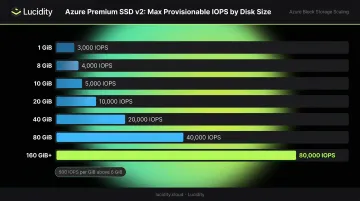
After 6 GiB, maximum provisionable IOPS increases at 500 IOPS per GiB, up to the absolute ceiling of 80,000 IOPS. A disk must be at least 160 GiB to unlock the full 80,000 IOPS limit.
| Disk Size | Max Provisionable IOPS |
|---|---|
| 1 GiB | 3,000 |
| 8 GiB | 4,000 |
| 10 GiB | 5,000 |
| 20 GiB | 10,000 |
| 40 GiB | 20,000 |
| 80 GiB | 40,000 |
| 160 GiB+ | 80,000 (ceiling) |
You can provision fewer IOPS than the ceiling — you only pay for what you set.
Throughput Scaling Formula
Maximum throughput scales at 0.25 MB/s per provisioned IOPS. Here's how that plays out:
| Provisioned IOPS | Max Throughput Ceiling |
|---|---|
| 3,000 | 750 MB/s |
| 4,000 | 1,000 MB/s |
| 6,000 | 1,500 MB/s |
| 8,000+ | 2,000 MB/s (ceiling) |
Note: Microsoft's disk types documentation lists 5,000 IOPS as the threshold for 2,000 MB/s, while the billing page references 8,000 IOPS. The exact cutoff varies across documentation — verify against current Microsoft docs before provisioning.
The IOPS–Throughput Coupling and Adjustment Rules
The Dependency That Catches Engineers Off Guard
IOPS and throughput can be set independently within their allowed ranges, but throughput has a ceiling that's a direct function of provisioned IOPS. This creates a dependency chain that's easy to miss.
Scenario 1 — Invalid configuration: A team provisions a 200 GiB disk with the baseline 3,000 IOPS and tries to set throughput to 1,500 MB/s. This configuration is invalid. At 3,000 IOPS, the throughput ceiling is 3,000 × 0.25 = 750 MB/s. To unlock 1,500 MB/s, they need at least 6,000 IOPS provisioned.
Scenario 2 — Cost inefficiency: A disk provisioned for 10,000 IOPS has a throughput ceiling of 2,000 MB/s available. If the workload only needs 500 MB/s throughput, the team is paying for 10,000 IOPS to support a throughput requirement they could have unlocked with 2,000 IOPS. Right-sizing both dimensions matters, not just one.
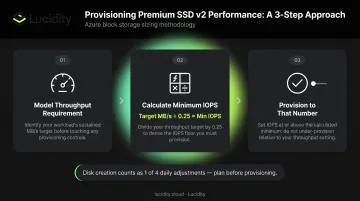
The correct approach follows three steps:
- Model your actual throughput requirement first
- Calculate the minimum IOPS needed to unlock it: target MB/s ÷ 0.25 = minimum IOPS
- Provision to that number rather than guessing high
The 4-Times-Per-24-Hour Adjustment Rule
Premium SSD v2 allows performance changes without downtime — no disk detach, no VM restart required. The constraint is cadence: you can adjust IOPS and throughput up to four times within any 24-hour period. Disk creation itself counts as one of those four adjustments, leaving only three additional changes available in the first 24 hours after provisioning.
For teams running load tests or responding to a peak event, three adjustments go fast. Plan your IOPS and throughput settings before disk creation rather than iterating post-creation. Burn through adjustments during a test window, and you may not be able to respond to a performance issue until the 24-hour window resets.
Consequences of Exceeding or Under-Provisioning IOPS and Throughput
What Throttling Actually Looks Like
When a workload exceeds provisioned IOPS or throughput, Azure caps performance at the provisioned limit — excess requests queue up or get rejected. The observable effects:
- Latency increases, sometimes sharply
- Query execution time grows on databases
- Application timeouts start appearing
- In OLTP systems, cascading slowdowns can propagate up the stack
Azure exposes a VM uncached IOPS Consumed Percentage metric — when it hits 100%, throttling is actively occurring. Monitoring this metric alongside Data Disk Queue Depth is how you confirm whether a performance problem is disk-related or further up the stack.
The Cost of Over-Provisioning
Throttling is expensive in application terms; over-provisioning is expensive in spend terms. A team running 4,000 IOPS consistently on a disk provisioned for 20,000 IOPS is paying for 17,000 IOPS they'll never use. Across a fleet of dozens of disks, that waste compounds fast.
McKinsey research on cloud cost optimization found that organizations can reduce cloud costs by 15–25% through targeted cost practices, with overprovisioned resources consistently appearing as a primary waste driver. IOPS and throughput over-provisioning on Premium SSD v2 is a direct example — invisible in most cloud cost dashboards until someone looks specifically at provisioned vs. consumed performance metrics.
Getting provisioning right means tracking actual consumption over time, not guessing upfront. Lucidity's Lumen provides visibility into Azure block storage utilization — surfacing historical IOPS, throughput, latency, and cost trends across every disk so right-sizing decisions are grounded in real usage data, not estimates.
The VM-Level I/O Cap: The Hidden Ceiling
Disk-level limits are only half the equation. Every Azure VM size has its own maximum uncached disk IOPS and throughput limits, and when the VM's cap is lower than the disk's provisioned values, the VM becomes the bottleneck.
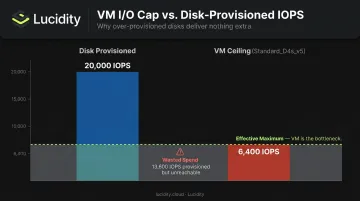
A concrete example: the Standard_D4s_v5 has a maximum uncached disk IOPS limit of 6,400 and 145 MB/s throughput. Attach a Premium SSD v2 provisioned for 20,000 IOPS to this VM and you'll never see more than 6,400 IOPS delivered. The remaining 13,600 provisioned IOPS represent pure cost with no performance return.
Always check VM-level IOPS and throughput caps alongside disk provisioning specs before finalizing a configuration. If the two numbers aren't in the same range, the lower one is the only number that matters — and any provisioning above it is spend with no return.
Common Misconfigurations When Provisioning IOPS and Throughput
These are the patterns that appear most often in misconfigured deployments:
Treating the 3,000 IOPS baseline as production-ready for any workload. It works for light-use disks, but a medium-sized OLTP database under normal load will saturate it. The cost of a few thousand additional IOPS is modest compared to the cost of application slowdowns.
IOPS and throughput don't scale independently at all values. Doubling IOPS won't double available throughput once you hit the coupling ceiling, and the 0.25 MB/s per IOPS formula sets the hard maximum regardless of what throughput value you provision.
Ignoring VM-size I/O ceilings during benchmarking. Benchmarks run against the disk in isolation will always show full provisioned capacity. Once the VM is in the picture, the real ceiling may be lower — always verify the VM's uncached I/O limits before attributing performance problems to the disk.
Over-provisioning IOPS just to unlock a higher throughput ceiling. Because throughput maximum scales with IOPS, some teams provision far more than the workload needs to hit a throughput target. Instead, calculate the minimum IOPS your throughput requires (throughput ÷ 0.25) and provision to that number.
Frequently Asked Questions
What is the baseline IOPS and throughput included with every Azure Premium SSD v2 disk?
Every Premium SSD v2 disk includes 3,000 IOPS and 125 MB/s throughput at no additional charge, regardless of disk size. Provisioning IOPS above 3,000 or throughput above 125 MB/s incurs incremental per-unit cost billed as separate line items from capacity.
How does disk size affect the maximum IOPS I can provision on a Premium SSD v2?
Above 6 GiB, the maximum provisionable IOPS increases by 500 IOPS per GiB, capping at an absolute ceiling of 80,000 IOPS. A disk must be at least 160 GiB to be eligible for the full 80,000 IOPS provisioning limit.
Can I adjust IOPS and throughput on a Premium SSD v2 without detaching the disk or restarting the VM?
Yes. Performance adjustments are made online with no downtime required. You can make up to four adjustments within any 24-hour window, but disk creation counts as one — leaving three remaining changes on the first day.
What happens if my workload exceeds the provisioned IOPS or throughput limit?
Azure caps I/O at the provisioned limit; excess requests are queued or dropped, which drives up latency and can cause application timeouts. Increasing provisioned IOPS or throughput — within your quota for that 24-hour window — resolves the bottleneck.
Why can't I set throughput to 2,000 MB/s on a disk with only 3,000 IOPS provisioned?
Throughput ceiling equals 0.25 MB/s × provisioned IOPS, so 3,000 IOPS limits throughput to 750 MB/s. Reaching 2,000 MB/s requires at least 8,000 provisioned IOPS — verify the exact threshold in the Azure disk types documentation before provisioning, as Microsoft's billing and disk-types pages can cite different figures.
Does my VM size limit how much IOPS and throughput my Premium SSD v2 can actually deliver?
Yes. Every Azure VM size has its own maximum uncached disk IOPS and throughput limits that act as a hard ceiling above the disk's own limits. If the VM's cap is lower than the disk's provisioned values — as is the case attaching a high-IOPS disk to a Standard_D4s_v5 — the VM becomes the bottleneck and provisioned disk performance above that cap goes unused.