What makes Premium SSD V2 genuinely interesting is its design: provisioned IOPS and throughput are independently configurable from capacity, giving engineers more control than any previous managed disk tier. But that flexibility comes with complexity. Understanding what latency Azure actually guarantees, where real-world numbers land across the full percentile distribution, and which operational factors cause degradation—these aren't optional details. They're prerequisites for correct workload placement.
This article covers all of it: the specification language, the mechanics behind the numbers, the factors that inflate latency in practice, and how to measure what you're actually getting.
Key Takeaways
- Premium SSD V2 targets sub-millisecond disk latencies, with provisioned IOPS and throughput delivered 99.9% of the time — two distinct guarantees in Microsoft's documentation
- Latency is not a directly configurable parameter; it emerges from how IOPS provisioning, queue depth, and VM limits interact
- No host caching support—unlike Premium SSD v1, which means read latency optimization works differently
- Tail latency (P99+) behaves very differently from median latency, particularly when workloads approach provisioning ceilings
- VM-level throttling is a hidden latency driver — a well-provisioned disk attached to the wrong VM size can still fall short
What Latency Means in Azure Premium SSD V2
The Definition That Actually Matters
Microsoft defines disk latency as "the time it takes an application to receive a single request, send it to storage disks, and send the response to the client." That's the full round trip—queue wait time, data transfer, and acknowledgment—not just the physical read or write time.
This is distinct from:
- IOPS — how many operations per second the disk can process
- Throughput (MB/s) — how much data moves per second
All three are interdependent but measure different things. A disk can have excellent IOPS and throughput while still delivering poor latency if queue depths are mismanaged.
The Queue Depth Relationship
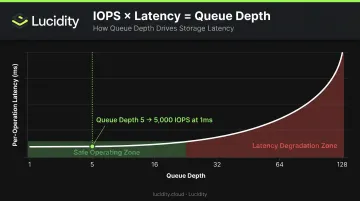
Microsoft documents this explicitly: IOPS × Latency = Queue Depth. Their example: to achieve 5,000 IOPS at 1ms average latency, you need a queue depth of 5.
Pushing queue depth higher drives more IOPS, but each request waits longer before being serviced — per-operation latency climbs as a result. For OLTP workloads where individual transaction latency matters more than aggregate throughput, over-tuning queue depth is a common and costly mistake.
Latency as a Design Constraint, Not a Setting
Unlike Premium SSD v1, where latency was largely determined by disk size tier, Premium SSD V2 lets you set capacity, IOPS, and throughput independently. Latency itself isn't directly configurable. It's an outcome shaped by your provisioning choices, queue depth, workload pattern, and VM limits working together.
One important caveat for teams migrating from v1: Premium SSD V2 does not support host caching. With v1, ReadOnly host caching could reduce effective read latency significantly by serving reads from VM memory and local SSD. Microsoft's position is that V2's lower native storage-layer latency compensates for this, but teams that relied heavily on read caching should validate that assumption for their specific workload mix before migrating.
Azure Premium SSD V2 Latency Specifications
What Microsoft Actually Guarantees
According to Microsoft's managed disk types documentation, Premium SSD V2 is "designed to provide sub millisecond latencies" and to deliver provisioned IOPS and throughput 99.9% of the time.
These are two separate statements—and the distinction matters. Microsoft ties the 99.9% SLA explicitly to provisioned IOPS and throughput performance. The sub-millisecond latency language is a design target, not a percentile guarantee backed by the same SLA wording. Don't treat them as equivalent.
For context, the current specification limits are:
| Parameter | Baseline | Maximum |
|---|---|---|
| IOPS | 3,000 | 80,000 |
| Throughput | 125 MB/s | 2,000 MB/s |
| Capacity | 1 GiB | 64 TiB |
Compare this to Premium SSD v1, which targets single-digit millisecond latency at 99.9% of the time. V2's sub-millisecond design target represents a meaningful step forward—particularly relevant at high IOPS loads where v1 would show more pronounced latency degradation.
Tail Latency vs. Median Latency
Median (P50) latency and tail latency (P99, P99.9) tell very different stories—and understanding this gap is what the SLA language above doesn't fully address. This distinction matters for production workload design.
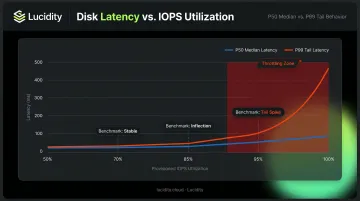
No authoritative public benchmark with a complete P50–P99.9 distribution for Premium SSD V2 under sustained load has been published. What Microsoft's documentation does make clear is the throttling mechanism: as workloads approach provisioned limits, Azure increases latency rather than dropping requests.
This latency increase is non-linear. The disk stays relatively stable at lower utilization, then climbs sharply as it approaches its provisioning ceiling.
The practical implications for production workload design:
- Maintain headroom below provisioned limits—sustained operation at 90–95% of provisioned IOPS produces tail latency behavior that looks nothing like what you measured at 60–70%
- Benchmark P99 latency specifically at 70%, 85%, and 95% utilization before deploying to production
- Don't rely on P50 numbers alone when evaluating fit for latency-sensitive workloads
Key Factors That Influence Premium SSD V2 Latency in Practice
Published sub-millisecond specs assume adequate provisioning, a compatible VM size, correct deployment zone, and a workload operating within defined limits. Real-world environments frequently deviate on at least one of these dimensions.
VM-Level and Disk-Level Throttling
Azure enforces two independent throttling layers. Most engineers focus on the disk-level limits—provisioned IOPS and throughput for the Premium SSD V2 disk itself. The second layer, VM-level limits, is where surprises happen.
Every VM size has its own uncached disk IOPS and storage bandwidth ceiling. Microsoft documents this clearly: if an application exceeds VM or disk limits, throttling occurs, and degraded performance appears as higher latency, lower throughput, or lower IOPS.
Consider a disk provisioned for 20,000 IOPS attached to a VM with a 24,000 uncached IOPS ceiling—but three other disks on that same VM consume 10,000 IOPS. Only 14,000 IOPS remain available for your Premium SSD V2, regardless of what the disk itself can deliver. The disk isn't throttled at the disk layer. The VM is throttled at the VM layer.
A correctly provisioned disk attached to an undersized or over-subscribed VM will appear to underperform.
Control Plane Operations and Sector Size Effects
VM-level throttling affects runtime performance. A separate class of latency appears during control plane operations—certain Azure actions trigger a background data migration that can run for several hours (typically under 24 hours) and elevate latency throughout that window. The triggers include:
- Resizing a disk
- Changing storage type
- Detaching and re-attaching a disk
- Creating a managed disk from a snapshot
Sector size determines which I/O types are affected. Disks using the default 4K physical sector size see elevated read latency only. Disks configured with 512E sector size experience elevated latency for both reads and writes.
For write-sensitive workloads, 4K is the lower-risk choice when these operations are anticipated.
One regional factor also deserves attention at deployment time: Premium SSD V2 in regions without Availability Zone support may see slightly higher average latency than AZ-supported deployments. This is a design decision that cannot be changed after disk creation—it should be part of any architecture review for latency-sensitive systems.
How to Measure and Validate Premium SSD V2 Latency
Benchmarking Tools and Parameters
Microsoft recommends DiskSpd for Windows and FIO for Linux when benchmarking Azure Disk Storage. Synthetic tools like these isolate disk behavior from application overhead—they're the right choice when comparing disk types or validating provisioned performance before production deployment. OS counters (PerfMon on Windows, iostat on Linux) are better suited for continuous production monitoring.
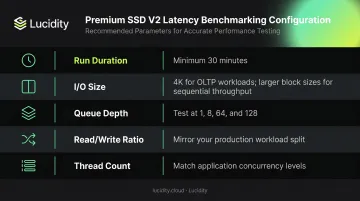
For meaningful latency distributions, configure your benchmarks with:
- Run duration: Minimum 30 minutes for sustained load tests — shorter runs won't reach steady state and skew results low
- I/O size: Use 4K for OLTP workloads, larger blocks for sequential reads — mismatching this inflates or deflates your numbers
- Queue depth: Test several values (e.g., 1, 8, 64, 128) — a single setting hides how latency degrades under concurrency
- Read/write ratio: Mirror your production split — a 70/30 read-heavy ratio behaves very differently than pure write load
- Thread count: Match your application's actual concurrency level to avoid artificial bottlenecks in the test
Microsoft's sample DiskSpd parameters include -c200G -w100 -b4K -F4 -r -o128 -W7200 -d30 -Sh. Their FIO sample uses iodepth=256, bs=4k, numjobs=4. These are starting points for high-IOPS testing—adjust to your workload profile.
Interpreting Results Beyond the Average
Average latency alone won't give you the full picture for production. Examine the full percentile spectrum: P50, P90, P99, and P99.9.
A disk showing excellent P50 latency but extreme P99.9 spikes may be unsuitable for OLTP workloads even when average latency looks acceptable. The P99.9 behavior under sustained load is what application timeouts and lock contention will actually reflect.
Run tests at increasing IOPS loads—50%, 75%, 90%, and 100% of provisioned IOPS. This reveals the throttling inflection point: the load level where tail latency begins deteriorating significantly. That number tells you your safe operating ceiling for production.
Knowing that ceiling matters — but enforcing it manually across dozens or hundreds of volumes doesn't scale. Lucidity's Lumen continuously tracks IOPS, throughput, and latency across all your Azure disk volumes. It scores each disk's tier against actual usage and surfaces historical trends, so you can spot disks approaching their provisioning limits before latency degradation reaches production.
Operating Beyond the Latency Threshold
What Throttling Actually Looks Like
When a Premium SSD V2 workload exceeds its provisioned IOPS or throughput limits, Azure throttles the disk by increasing latency. The effect isn't linear. Latency behavior stays relatively stable through moderate utilization, then rises sharply as the disk approaches its ceiling.
For OLTP applications, this manifests as:
- Slow query response times that appear intermittently
- Increased lock contention as transactions take longer to complete
- Application-layer timeouts that are difficult to trace to storage without proper monitoring
These symptoms are frequently misdiagnosed as CPU or memory bottlenecks. Storage throttling typically doesn't generate obvious error messages—it just makes everything slower.
The downstream effects vary by workload type. For SQL Server, elevated disk latency increases transaction log flush times, which slows commit rates and reduces application-layer throughput. Streaming and real-time analytics workloads see a different failure mode: latency spikes translate directly to pipeline stalls and data lag.
The Over-Provisioning Response and Its Cost
The common response to latency complaints is to increase provisioned IOPS and throughput. This works—but it's expensive when that headroom goes idle during off-peak periods.
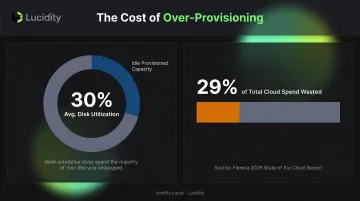
This pattern is widespread. Lucidity's analysis across enterprise customers shows average disk utilization of approximately 30%, with organizations provisioning far more capacity than their workloads actually consume. Over-provisioning IOPS and throughput as a latency buffer follows the same logic—paying for headroom that sits idle outside peak windows. Flexera's 2026 State of the Cloud Report puts the broader cost in context: wasted cloud spend has reached 29% across cloud environments, and storage over-provisioning is a significant contributor.
The more sustainable approach: measure actual utilization first, establish where the throttling inflection point falls for your specific workload, then provision with deliberate headroom above that threshold. Not arbitrary multiples of expected peak.
Common Misinterpretations of Premium SSD V2 Latency
"Sub-Millisecond" Doesn't Mean Every I/O
The most widespread misreading of the Premium SSD V2 spec is treating "sub-millisecond latency" as a guaranteed median for all I/O operations under all conditions.
Sub-millisecond is a design target achievable under low-contention, well-provisioned conditions. For production database workloads operating at meaningful queue depths and IOPS loads, real-world median latency will typically fall in the low single-digit millisecond range.
That's still a clear improvement over Premium SSD v1's single-digit millisecond target — but it's not sub-millisecond for every operation in every scenario.
The 99.9% SLA language in Microsoft's documentation applies to provisioned IOPS and throughput delivery, not to a latency percentile guarantee. Confusing the two leads teams to set latency expectations the SLA was never designed to support.
Host Caching Expectations from V1
Teams migrating from Premium SSD v1 sometimes expect to enable ReadOnly host caching to reduce read latency, as they did with v1 disks. Premium SSD V2 does not support host caching.
Microsoft's position is that V2's lower native storage-layer latency addresses the same performance gap that host caching served on v1. For many workloads, that's accurate. The key distinctions to keep in mind:
- V1 BlobCache: Sub-millisecond reads achievable through host-level caching
- V2 native latency: Lower baseline than V1, but no host cache layer available
- Validation required: Workloads that relied heavily on BlobCache read performance need benchmarking — not assumption — before migrating
Frequently Asked Questions
What is the latency SLA for Azure Premium SSD V2?
Microsoft states that Premium SSD V2 is designed to provide sub-millisecond disk latencies, with provisioned IOPS and throughput delivered 99.9% of the time. The sub-millisecond language is a design target; the 99.9% SLA applies to IOPS and throughput delivery at normal load levels.
Does Azure Premium SSD V2 support host caching to reduce latency?
No—Premium SSD V2 does not support host caching, unlike Premium SSD v1. Microsoft designed V2's lower native storage-layer latency to compensate for this, but teams migrating from v1 workloads that depended heavily on ReadOnly caching should validate read latency performance before cutover.
How does VM-level throttling affect Premium SSD V2 latency?
Each VM has its own uncached disk IOPS and bandwidth ceiling covering all attached disks combined. Once that ceiling is hit, Azure increases latency regardless of individual disk headroom—so a correctly provisioned Premium SSD V2 can still underperform if the host VM is over-subscribed.
When should I choose Ultra Disk over Premium SSD V2 for latency-sensitive workloads?
Choose Ultra Disk when you need the lowest and most consistent tail latency—SAP HANA and high-tier transactional databases with strict sub-millisecond P99 requirements. Premium SSD V2 offers better price-to-performance for enterprise workloads where median latency, not worst-case tail latency, is the binding constraint.
Can I adjust Premium SSD V2 performance without causing latency disruption or downtime?
Yes—IOPS and throughput can be adjusted up to four times per 24-hour period without downtime (disk creation counts as one adjustment). That said, certain control plane operations trigger background storage migrations that temporarily elevate latency, even without a performance change.
How does sector size (4K vs. 512E) affect Premium SSD V2 latency during migrations?
During background storage migrations triggered by control plane operations, 4K sector size disks experience elevated read latency only. Disks configured with 512E sector size experience elevated latency for both reads and writes. For write-sensitive workloads, 4K is the lower-risk choice.