Missing any one of these creates real problems. A disk hitting 95% space usage causes write failures. A disk consistently maxing out its IOPS budget causes application latency. An unattached disk sitting idle continues to accrue charges even though nothing is using it.
This guide covers three specific Azure CLI methods to check each dimension, what the output actually means, and what to do based on the results.
Key Takeaways
- Run
az disk showfor provisioned size; SSH into the VM and usedf -hto check actual used/available space - Pull IOPS and bandwidth consumed percentages via
az monitor metrics list— no SSH required - Filter
az disk listbymanagedBy==nullto find unattached disks you're paying for but not using - Above 80% on performance signals a bottleneck; below 30% on space or IOPS means you're over-provisioned
Prerequisites: What You Need Before Running These Commands
Required Access and Tools
- Azure CLI version 2.x or later — verify with
az version, or use Azure Cloud Shell at shell.azure.com (no install required) az login— required for an authenticated session- Reader role at minimum for disk inventory; Monitoring Reader role for
az monitor metrics list - Run
az account set --subscription <SubscriptionId>to set the active subscription before running commands
Key CLI Command Groups Used in This Guide
| Command Group | What It Does |
|---|---|
az disk |
Lists and inspects managed disk metadata (size, state, attachment) |
az vm |
Retrieves VM resource IDs and storage profiles |
az monitor metrics list |
Pulls IOPS and bandwidth consumed percentage time-series data from Azure Monitor |
Scoping Note
All three methods can be scoped to a single disk, a resource group, or the full subscription. Before running any list command:
- Add
--resource-group <RGName>to narrow results to a specific resource group - Run
az account showto confirm which subscription is currently active — omitting the flag targets everything visible in that subscription
Three Methods to Check Azure Managed Disk Utilization
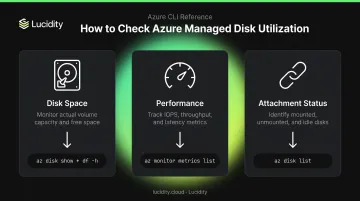
There's no single CLI command that covers disk space usage, performance metrics, and attachment status together. Each dimension requires a different approach:
- Disk configuration and attachment state →
az disk show - OS-level filesystem usage → SSH +
df -h - Azure Monitor telemetry →
az monitor metrics list
Method 1: Check Disk Space Utilization (Provisioned Size vs. Actual Usage)
What This Measures
Azure bills you for the provisioned tier size regardless of how much data you've actually written. A 1 TB P30 disk costs $135.17/month in East US LRS whether it contains 50 GB of data or 900 GB. az disk show tells you what you're billed for; df -h inside the VM tells you what's actually used.
Step 1 — Retrieve Disk Metadata
az disk show \
  --name <DiskName> \
  --resource-group <RGName> \
  --query "[diskSizeGb, diskState, managedBy]" \
  -o table
This returns:
- diskSizeGb — provisioned size (what you're paying for)
- diskState —
Attached,Unattached, orReserved(attached to a stopped-deallocated VM) - managedBy — resource URI of the attached VM, or null if unattached
Step 2 — Check Actual OS-Level Usage
SSH into the VM and run:
df -h | grep -i "sd"
The output shows Size, Used, Avail, and Use% for each mounted disk. The Use% column is your real space utilization figure.
If a data disk shows up in az disk show as attached but doesn't appear in df -h, it may be attached in Azure but not mounted in the OS. Run lsblk to see all block devices, including unmounted ones.
Step 3 — Cross-Reference
Compare diskSizeGb from az disk show with the Size column from df -h. A Use% below 20–30% consistently means the disk is oversized for its actual workload. Above 85%, start planning an expansion — full disks trigger write failures immediately, with no graceful degradation.
⚠️ Limitation: This method requires SSH access to the VM and only works for attached disks. Unattached disks have no running OS to query.
Method 2: Check Performance Utilization via Azure Monitor CLI
What This Measures
Azure Monitor tracks how much of a disk's provisioned IOPS and bandwidth budget is actively consumed, expressed as a percentage. These metrics live under the VM resource (not the disk resource), require no SSH access, and work historically across any time window.
Important: These metrics are only available on VM series that support Premium Storage, such as the Dsv3 series.
Step 1 — Get the VM Resource ID
vmId=$(az vm show \
  --resource-group <RGName> \
  --name <VMName> \
  --query id \
  -o tsv)
Step 2 — Query IOPS Consumed Percentage
az monitor metrics list \
  --resource $vmId \
  --metric "Data Disk IOPS Consumed Percentage" "OS Disk IOPS Consumed Percentage" \
  --interval PT1M \
  --output table
For bandwidth, swap the metric names:
az monitor metrics list \
  --resource $vmId \
  --metric "Data Disk Bandwidth Consumed Percentage" "OS Disk Bandwidth Consumed Percentage" \
  --interval PT1M \
  --output table
Step 3 — Check VM-Level Uncached Utilization
The disk itself might have headroom, but the VM's own IOPS ceiling could still be the bottleneck. If this percentage is consistently near 100% while disk-level metrics look fine, the VM size is the constraint, not the disk tier.
az monitor metrics list \
  --resource $vmId \
  --metric "VM Uncached IOPS Consumed Percentage" "VM Uncached Bandwidth Consumed Percentage" \
  --interval PT1M \
  --output table
Available Performance Metrics at a Glance
| Metric | Granularity | Notes |
|---|---|---|
| Data Disk IOPS Consumed Percentage | PT1M | Per-LUN dimension available |
| OS Disk IOPS Consumed Percentage | PT1M | — |
| VM Uncached IOPS Consumed Percentage | PT1M | VM-level ceiling |
| Data Disk Bandwidth Consumed Percentage | PT1M | Per-LUN dimension available |
| OS Disk Bandwidth Consumed Percentage | PT1M | — |
| Data Disk Used Burst IO Credits Percentage | PT5M | Check separately for burst workloads |
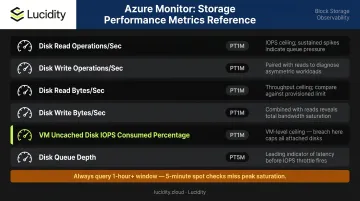
Limitation: Metrics emit at PT1M and may miss sub-minute spikes. Always query at least a 1-hour or 24-hour window with average aggregation. A 5-minute spot check will miss peak-hour saturation.
Method 3: Identify Unattached and Idle Managed Disks
What This Measures
When a VM is deleted, its managed disks are not automatically deleted — Azure preserves them to prevent accidental data loss. Those disks keep billing you. The managedBy property is null for any disk with no attached VM.
Step 1 — List All Unattached Disks in a Subscription
az disk list \
  --query "[?managedBy==\`null\`].[name, resourceGroup, diskSizeGb, diskState, timeCreated]" \
  -o table
Add --resource-group <RGName> to narrow the scope to one resource group.
Step 2 — Check When a Disk Was Last in Use
For each disk surfaced in Step 1, pull its ownership history:
az disk show \
  --name <DiskName> \
  --resource-group <RGName> \
  --query "[name, diskSizeGb, diskState, lastOwnershipUpdateTime]" \
  -o table
lastOwnershipUpdateTime is the UTC timestamp of the last attach or detach event — not the disk creation date. Any disk with a null managedBy and a lastOwnershipUpdateTime six months in the past is a strong deletion candidate.
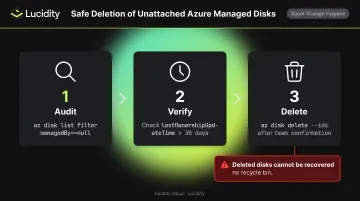
Step 3 — Safe Deletion Workflow
Safe deletion order: Run the audit first, confirm with the owning team, then delete:
az disk delete --ids <DiskId> --yes
Deleted disks cannot be recovered. There is no recycle bin.
Limitation: This method only catches fully unattached disks. Disks attached to a running VM but with zero actual I/O activity — meaning the application never reads or writes to them — won't appear here. Detecting those requires OS-level inspection or a platform that tracks zero-I/O disks alongside unattached ones — the kind of idle disk visibility Lucidity's Lumen product surfaces automatically across your Azure environment.
How to Interpret Your Results
Space Utilization Thresholds
| Use% (from df -h) | What It Means | Recommended Action |
|---|---|---|
| > 85% | Near capacity — write failures imminent | Run az disk update --size-gb <NewSize> immediately |
| 50–85% | Healthy range | No action needed |
| < 20–30% | Consistent over-provisioning | Consider downsizing to reduce spend |
The cost difference between tiers is significant. A P30 (1 TB) runs $135.17/month in East US LRS. If your workload actually fits on a P10 (128 GB) at $19.71/month, that's over $100/month per disk in unnecessary spend — before you count disks in multiple regions.
Performance Utilization Thresholds
- Near 100% IOPS or bandwidth: The application is I/O-capped — latency increases and response times degrade. Upgrade the disk tier or resize the VM.
- Below 20–30% across all metrics: You're paying for more than the workload needs. A P30 running P10 workloads wastes $115/month per disk, billed regardless of actual I/O.
Attachment Utilization Action
Any disk with managedBy=null and a lastOwnershipUpdateTime older than 30 days should be flagged for deletion or archival.
For teams managing large disk estates, Lucidity's Lumen automatically surfaces all four categories of idle disks — unattached, reserved, unmounted, and zero-I/O. CLI audits show a point-in-time snapshot; Lumen tracks drift over time and flags disks the moment they go idle.
Common Mistakes and Best Practices
Mistakes to Avoid
- Confusing provisioned size with actual usage.
az disk showreturns what you're billed for, not what's written to the filesystem. A 1 TB provisioned disk can contain 50 GB of data. - Querying IOPS over too short a window. A 5-minute spot check on a workload with daily peaks will look fine at 2 AM and miss the 9 AM saturation event. Always use a 1-hour minimum with average aggregation.
- Deleting immediately on null managedBy. Always check
lastOwnershipUpdateTimeand confirm with the owning team. Some disks are intentionally kept detached as snapshots or standby resources.
Best Practices for Ongoing Monitoring
Two practices make the biggest difference at scale:
Schedule the unattached disk audit as a runbook. Running the Method 3 query manually means disks orphaned mid-week stay invisible until the next check. A weekly Azure Automation runbook closes that gap automatically.
Set proactive metric alerts before users report slowdowns. Create an IOPS alert using the correct az monitor metrics alert create syntax:
VM_ID=$(az vm show -g <resource-group> -n <vm-name> --query id -o tsv)

az monitor metrics alert create \
  --name data-disk-iops-over-90 \
  --resource-group <alert-rule-resource-group> \
  --scopes "$VM_ID" \
  --condition "avg Data Disk IOPS Consumed Percentage > 90" \
  --window-size 5m \
  --evaluation-frequency 1m \
  --description "Data Disk IOPS above 90 percent"
Note the --scopes flag (not --resource) — this is the correct parameter for metric alert creation.
Scaling the Practice
The CLI methods above work well for targeted investigations, but they don't scale across dozens of subscriptions. At that point, manual checks become a liability rather than a practice.
Lucidity's AutoScaler handles disk expansion autonomously before capacity runs out, with no tickets or downtime required. Lumen continuously monitors IOPS, throughput, latency, and cost trends to flag tiering candidates and idle disks across your entire Azure estate. The free Lucidity Assessment scans your environment in about 5 minutes, with no agents or infrastructure changes required.
Frequently Asked Questions
How do I check disk utilization in Azure?
Use three approaches together: az disk show for provisioned size metadata, az monitor metrics list for IOPS and bandwidth consumed percentages, and az disk list filtered by managedBy==null for unattached disk identification.
How do I tell if an Azure VM is using managed disks?
Run az vm show --resource-group <RG> --name <VMName> --query "storageProfile" -o json. If the OS disk or data disks contain a managedDisk property with an id, the VM is using managed disks rather than unmanaged (page blob) disks.
What is the availability of managed disks in Azure?
A managed disk can be in one of three states: Attached, Unattached, or Reserved. Check the current state anytime with az disk show --query diskState — no VM access required.
What Azure CLI command lists all managed disks in a subscription?
az disk list --query "[].{Name:name, RG:resourceGroup, SizeGB:diskSizeGb, State:diskState, ManagedBy:managedBy}" -o table
Omitting --resource-group scopes the query to all disks visible in the currently active subscription.
How do I check if an Azure managed disk is underutilized?
Combine a low Use% from df -h (space underuse) with consistently low IOPS and bandwidth consumed percentages from az monitor metrics list. Both signals together indicate the provisioned disk tier and size exceed what the workload actually needs.
Can I check disk utilization without logging into the VM?
Yes. az monitor metrics list returns IOPS and bandwidth percentages, and az disk show provides provisioned size and disk state — both without SSH access. Filesystem space usage (Use%) does require SSH or a VM agent.