Introduction
Cloud storage health problems are easy to miss until they're expensive. A volume sitting unattached for months still bills by the gigabyte. A disk showing "attached" and "healthy" in the console may not have seen a single read or write in weeks. A volume approaching capacity can cause application downtime with no warning.
For enterprise teams managing hundreds of volumes across AWS, Azure, and Google Cloud, these gaps add up fast. The FinOps Foundation identifies abandoned EBS volumes as one of the most common forms of cloud waste, and Microsoft explicitly documents deleting unattached managed disks to reduce unnecessary costs.
This guide covers the tools, CLI commands, and third-party platforms for checking cloud storage health — including how to interpret what you find and the mistakes that cause most teams to miss the worst offenders.
Key Takeaways
- Cloud storage health covers volume state, IOPS/throughput performance, capacity utilization, and idle disk status
- Three main approaches: cloud-native consoles, CLI queries, and third-party monitoring platforms
- Healthy volumes sit in "in-use" or "available" states with IOPS and throughput within provisioned limits
- Warning signs include zero-I/O disks, unattached volumes, utilization consistently above 70–80%, and unexplained latency spikes
- Continuous monitoring catches issues that manual audits routinely miss — automate your checks
What You Need to Check Cloud Storage Health
Before running any health checks, get the prerequisites in order. Missing permissions or an incomplete scope will give you a false picture.
Tools and Access Required
| Provider | Inventory & Status | Metrics | Cost Data |
|---|---|---|---|
| AWS | AmazonEC2ReadOnlyAccess (covers ec2:Describe* APIs) |
CloudWatchReadOnlyAccess |
Cost Explorer IAM access |
| Azure | Reader role + Microsoft.Compute/disks/read |
Monitoring Reader role | Azure Cost Management permissions |
| GCP | roles/compute.viewer (compute.disks.get, compute.disks.list) |
roles/monitoring.viewer |
Billing account viewer |
Azure note: There is no built-in "Disk Reader" role. Use the Reader role or a custom role that combines disk read operations with Monitoring Reader.
Preconditions and Setup
Complete both steps before running your first check:
Define scope explicitly. Cover attached volumes, unattached volumes, snapshots, and all storage accounts. Unattached disks are easy to overlook — if they're not in scope upfront, they won't show up in your results.
Pull baseline metrics first. Gather historical IOPS, throughput, and utilization data for your volumes. Without a baseline, you can't tell normal variance from a genuine anomaly.
Methods to Check Cloud Storage Health
Three approaches cover most use cases: a quick visual check in the cloud console, CLI-based queries for scripted audits, and third-party platforms for continuous multi-cloud monitoring.
Method 1: Cloud-Native Console and Dashboard Checks
Best for: Quick visual reviews, single-provider environments
Access needed: Cloud provider account with read access to compute and storage dashboards
Steps:
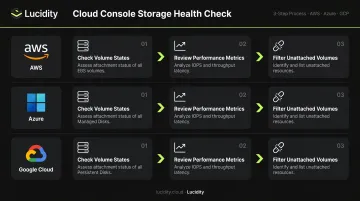
Check volume states. Navigate to the block storage section for your provider:
- AWS: EC2 → Volumes; filter for
errororimpairedstates - Azure: Disks; look for
diskStatevalues other thanAttachedorReserved - GCP: Compute Engine → Disks; filter for non-healthy status flags
- AWS: EC2 → Volumes; filter for
Review performance metrics. Open the monitoring panel for each volume and examine IOPS, throughput, and queue depth over the past 24–72 hours. Key AWS CloudWatch EBS metrics to check:
VolumeReadOpsandVolumeWriteOpsVolumeQueueLengthandBurstBalanceVolumeStalledIOCheck
Azure surfaces disk I/O, throughput, queue depth, and latency. GCP collects equivalent metrics at 1-minute intervals.
Filter for unattached volumes. On AWS, filter for volumes with
State = available(not in-use). On Azure, look for disks where theManagedByproperty is null. Flag anything not associated with a running instance.
Pros and cons:
- ✅ No setup required, fast for quick checks
- ❌ One provider at a time; no cross-account aggregation without manual context-switching
Method 2: CLI-Based Storage Health Queries
Best for: Multi-volume audits, repeatable scripted checks, faster filtering than console navigation
Access needed: AWS CLI, Azure CLI, or gcloud SDK installed and authenticated with appropriate IAM/RBAC permissions
AWS EBS commands:
# List all volumes and their states
aws ec2 describe-volumes

# Surface volumes with status check failures or I/O issues
aws ec2 describe-volume-status
describe-volume-status returns health states (ok, impaired, insufficient-data) and includes io-enabled and io-performance fields. AWS runs EBS volume status checks every 5 minutes — for gp3 and Provisioned IOPS volumes, the I/O performance check runs every 1 minute.
Azure Managed Disks commands:
# List all managed disks
az disk list

# Pull IOPS and latency metrics for a specific disk
az monitor metrics list --resource [DISK_RESOURCE_ID] --aggregation Average
GCP Persistent Disk commands:
# List all disks in a project
gcloud compute disks list

# Inspect a specific disk's properties
gcloud compute disks describe [DISK_NAME]
Pros and cons:
- ✅ Repeatable, automatable, handles multi-volume queries efficiently
- ❌ Requires scripting knowledge; credential management across accounts adds overhead at scale
Method 3: Third-Party Storage Health Monitoring Platforms
Best for: Multi-cloud environments, continuous monitoring, teams managing hundreds of volumes
Access needed: Read-only IAM roles or service principal connections; no agents or infrastructure changes required
Steps:
Connect cloud accounts. Authenticate your AWS, Azure, and GCP accounts using read-only roles. The platform maps all volumes automatically — including idle, unattached, and zero-I/O disks that don't surface in native dashboards.
Review the aggregated health view. Look for volumes flagged as degraded, unattached, or underutilized across all providers in a single interface.
Act on recommendations. Recommendations grounded in historical IOPS, throughput, latency, and cost trends show which volumes to right-size, which tiers to change, and which idle disks to delete — rather than relying on point-in-time snapshots.
Pros and cons:
- ✅ Deepest multi-cloud visibility with the least manual effort
- ✅ Identifies issues native consoles miss (zero-I/O disks, reserved but idle volumes)
- ❌ Requires connecting accounts; more setup than a quick console check
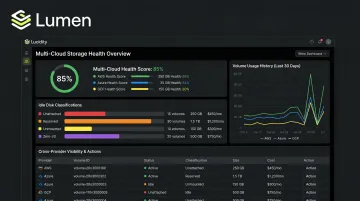
Lucidity's Lumen product was built specifically for this use case. It identifies four categories of idle disks — unattached, reserved, unmounted, and zero-I/O — across AWS, Azure, and GCP, and surfaces each with full context on age, attachment state, and usage history so teams can act without guesswork. Dometic reduced cloud storage spend by 52% after gaining this level of visibility.
How to Interpret Cloud Storage Health Results
Raw metrics mean little without a framework for reading them. The three states below map what you're seeing in CloudWatch, Azure Monitor, or GCP's operations suite to a concrete response.
Healthy State
- Volume in
in-useoravailablestate with no status check failures - IOPS and throughput within provisioned limits and consistent with workload patterns
BurstBalance(AWS) is not consistently depleted;VolumeStalledIOCheckreturns 0- No unattached volumes with no active workload attached
Action: Document current baselines. Schedule recurring checks.
When all four conditions hold, you're in good shape — but healthy today doesn't mean optimized. Watch for early drift signals before they compound.
Warning Signs
- Utilization consistently above 70–80% of provisioned capacity
- Latency creeping upward without a corresponding increase in workload
- Disks showing zero I/O over the past 7+ days (but still appearing "healthy" in the console)
BurstBalancedeclining consistently on AWS gp2 volumes
Action: Flag for right-sizing or decommissioning review — these patterns rarely self-correct.
Critical / Out-of-Spec
- Volume in
errororimpairedstate, orVolumeStalledIOCheckreturning 1 - IOPS throttling occurring regularly
- Unattached volumes with no workload association, still billing at full provisioned rate (AWS gp3: $0.08/GB-month; Azure Premium SSD v2: $0.081/GiB-month; GCP Standard PD: $0.000054795/GiB-hour)
- Status checks failing in CloudWatch or Azure Monitor
Action: Escalate to on-call ops immediately. Snapshot before touching anything, then reassign or delete flagged resources.
Common Mistakes When Checking Cloud Storage Health
1. Checking only attached volumes. Unattached disks are invisible to most manual workflows but continue billing at full provisioned rate. Filter explicitly for volumes with no running instance association — these are among the most consistent sources of wasted storage spend.
2. Relying on a single point-in-time reading. A volume that looks healthy at 9 AM may be throttling by noon. Review metrics over a rolling 24–72 hour window — AWS, Azure, and GCP all retain metric history that makes this straightforward.
3. Ignoring zero-I/O volumes. A disk can show as "attached" and "in healthy state" in the console while having had zero read/write activity for weeks. Standard console checks won't surface this without explicit I/O metric filtering. The FinOps Foundation has documented how failing to clean up idle EBS volumes is a persistent problem, even among experienced cloud engineers.
Best Practices for Ongoing Cloud Storage Health Monitoring
Three practices separate teams that catch storage problems early from those that discover them during incidents:
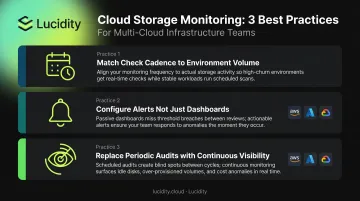
Match your check cadence to environment volume. High-volume production environments warrant daily automated monitoring. Smaller environments can run weekly audits. The point isn't frequency — it's that checks happen before incidents, not because of them.
Configure alerts, not just dashboards. Reviewing dashboards periodically still leaves gaps. AWS CloudWatch supports alarms on EBS metrics, Azure Monitor handles disk metric alerts, and GCP Cloud Monitoring collects disk data at 1-minute intervals with full alerting policy support. Set thresholds so health degradation triggers a notification before it becomes a manual discovery.
Replace periodic audits with continuous visibility. Threshold alerts catch what you've already defined as a problem. Continuous monitoring surfaces what you didn't know to look for — idle disks, right-sizing opportunities, and performance anomalies that only appear over time. Iron Mountain's Director of Operations noted they used to "spend countless hours provisioning cloud block storage" before moving to automated monitoring. Tools like Lucidity extend this across AWS, Azure, and Google Cloud without requiring dedicated engineering time for recurring audits.
Frequently Asked Questions
What is cloud storage health and why does it matter for enterprise teams?
Cloud storage health covers the operational state, I/O performance, and capacity utilization of block storage volumes across cloud providers. Poor health translates directly to application downtime and wasted spend — degraded volumes disrupt workloads while idle or over-provisioned disks keep billing with nothing to show for it.
How often should enterprise teams check cloud storage health?
Production environments benefit from continuous or daily automated monitoring. Smaller environments can run weekly audits. Either way, the goal is the same: catch issues before they cause incidents, not after.
What are the most important metrics to monitor for cloud block storage health?
Four signal categories together provide a complete picture: volume state (error vs. healthy), IOPS and throughput relative to provisioned limits, storage utilization percentage, and idle or unattached disk count.
How do I check cloud storage health on AWS EBS specifically?
Use AWS CloudWatch for volume status checks and I/O performance metrics, and the EC2 console Volumes section for state filtering. For scripted queries across multiple volumes, the AWS CLI offers two primary commands: aws ec2 describe-volumes and aws ec2 describe-volume-status.
What happens if I ignore cloud storage health issues?
Small issues compound quickly. A degraded volume ignored for days becomes an outage; an unattached disk left unchecked for months becomes a recurring line item on the bill. Most cloud storage incidents trace back to signals that were visible — just never acted on.
Can cloud storage health checks be automated?
Yes. Native tools like CloudWatch Alarms, Azure Monitor alerts, and GCP Cloud Monitoring alerting policies support automation at the provider level. Third-party platforms like Lucidity go further, continuously scanning all volumes across cloud providers and surfacing health signals, idle disk classifications, and optimization recommendations without manual intervention.