The problem compounds in multi-cloud environments. Flexera's 2025 State of the Cloud report found that 84% of organizations struggle to manage cloud spend, with budgets routinely exceeding limits by 17%.
This guide covers what cloud storage monitoring actually is, which metrics move the needle, the key challenges teams face, and the best practices that separate reactive firefighting from proactive cost control. It's written for ITOps, DevOps, and FinOps teams managing storage at scale.
Key Takeaways
- Cloud storage monitoring tracks performance, utilization, cost, and security of storage resources in real time
- Without it, organizations routinely over-provision, miss idle resources, and face unexpected cost spikes
- The five metrics that matter most: capacity utilization, IOPS/throughput, error rates, idle volume count, and egress costs
- Best practices include centralizing multi-cloud visibility, setting tiered alerts, and automating idle resource detection
- Manual, reactive monitoring fails at enterprise scale—automation is now the baseline, not the goal
What Is Cloud Storage Monitoring?
Cloud storage monitoring is the continuous process of observing, measuring, and managing cloud storage resources to ensure they meet performance, cost, and security targets. It covers two primary categories:
- Block storage — EBS (AWS), Azure Managed Disks, GCP Persistent Disks
- Object storage — Amazon S3, Azure Blob Storage, Google Cloud Storage
How It Differs from General Cloud Monitoring
General cloud monitoring covers the full stack: compute, networking, applications, and storage. Cloud storage monitoring narrows that lens to capacity, throughput, access patterns, and the cost of storage volumes and buckets specifically.
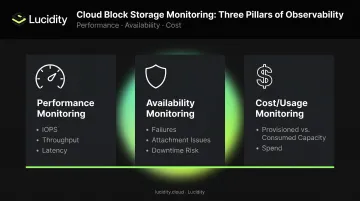
That narrower focus maps directly onto three core pillars:
- Performance monitoring — tracking IOPS, throughput, and latency
- Availability monitoring — detecting failures, attachment issues, and downtime risk
- Cost/usage monitoring — tracking provisioned vs. consumed capacity and spend
How It Works in Practice
Cloud storage monitoring relies on a combination of:
- Native cloud tools — AWS CloudWatch, Azure Monitor, Google Cloud Monitoring
- Third-party observability platforms — Datadog, Grafana, and similar tools
- Dedicated storage intelligence layers — platforms built specifically to surface metrics, anomalies, and recommendations specific to storage volumes
Native tools are useful but limited — they report on what's attached and active. They miss idle volumes that don't show up in standard dashboards, cross-cloud waste, and the gap between provisioned and consumed capacity.
Dedicated platforms fill that gap. Lucidity's Lumen, for example, surfaces idle disks that native consoles and standard advisor recommendations overlook, including four distinct idle disk states: unattached, reserved, unmounted, and zero-I/O.
Key Metrics to Track for Cloud Storage Monitoring
Not every metric deserves equal attention. These five categories consistently surface the highest-value signals for enterprise storage teams.
Capacity Utilization Rate
Capacity utilization measures the percentage of provisioned storage actually in use. It's the most fundamental storage metric, and the most commonly ignored.
IOPS throttling is often the first visible sign of a misconfigured or undersized volume. Catching it before latency climbs — rather than after an incident ticket lands — keeps the problem a tuning task instead of an outage.
Error Rates: Read/Write Errors and 4xx/5xx
Error rate monitoring reveals two distinct problem types:
- Client-side errors (4xx) — often indicate permission issues, misconfigured access policies, or application bugs
- Server-side errors (5xx) — signal infrastructure reliability problems or storage service degradation
A sudden spike in error rates frequently precedes a larger incident. S3's CloudWatch metrics include 4xxErrors and 5xxErrors at the bucket level. Tracking error trends over time, not just current state, gives teams early warning before issues cascade.
Idle and Unattached Volume Detection
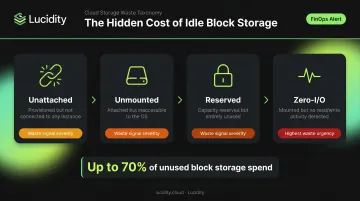
Idle disks are where significant cloud storage waste accumulates invisibly. Four distinct idle disk states warrant monitoring:
| Idle Disk Type | Description |
|---|---|
| Unattached | Provisioned but not connected to any compute instance |
| Unmounted | Attached to an instance but not accessible to the OS |
| Reserved | Capacity reserved but unused |
| Zero-I/O | Connected and mounted but generating no read/write activity |
The FinOps Foundation identifies abandoned EBS volumes and Azure unattached disks as recognized storage waste categories and recommends automated scripts to scan and terminate unattached volumes. Lucidity's Lumen product tracks all four idle disk states, including types that don't surface in native cloud dashboards, which together can represent up to 70% of unused block storage spend.
Data Egress and Cost Metrics
Storage cost monitoring extends well beyond raw capacity. Unexpected charges almost always come from egress:
- AWS charges $0.09/GB for S3 internet egress beyond the free 100 GB/month tier
- Azure charges $0.087/GB for the next 10 TB/month out of North America
- Google Cloud charges $0.12/GiB for Premium Tier egress from North America
Cross-region transfers, request counts, and API call volumes add additional layers of cost that raw storage dashboards don't expose. Teams that track only capacity metrics routinely miss egress accumulation until it appears on the monthly bill. Dedicated cost metrics — broken out by transfer type and request volume — are the only reliable way to catch these charges while they're still correctable.
Types of Cloud Storage Monitoring
Object Storage Monitoring
Object storage monitoring (S3, Azure Blob, Google Cloud Storage) operates at the bucket level. Critical metrics include:
- Storage size growth — sudden increases signal unexpected data accumulation
- Request volumes — tracking
GetRequests,PutRequests, andDeleteRequestsreveals usage patterns and anomalies - Prefix-level patterns — stale prefixes with no recent access often indicate abandoned data
AWS S3 pushes CloudWatch metrics including BucketSizeBytes, NumberOfObjects, and request-level counts. GCS tracks total_bytes and object_count for bucket growth monitoring.
Block Storage Monitoring
Block storage monitoring is where the largest cost waste typically accumulates. Key monitoring targets:
- Disk attachment status — identifying unattached and unmounted volumes
- IOPS utilization vs. provisioned limits — detecting throttling before it impacts workloads
- Volume throughput — tracking read/write bytes per second against provisioned capacity
- Idle disk states — unattached, unmounted, reserved, and zero-I/O volumes accumulating charges without use
Over-provisioning patterns in block storage are structurally persistent: provisioning up is easy, provisioning down requires complex data migration on AWS, Azure, and Google Cloud alike. That asymmetry is why block storage demands continuous monitoring, not just periodic reviews.
File and Database Storage Monitoring
Cloud file storage (EFS, Azure Files) and managed database storage require monitoring for:
- Available capacity and growth rate
- Query-driven I/O demand spikes
- Snapshot and backup storage accumulation
Growth rate monitoring matters most for SaaS applications and enterprise systems (CRM, ERP) running in the cloud, where storage growth is driven by user activity rather than infrastructure decisions.
Common Challenges in Cloud Storage Monitoring
Visibility Gaps in Multi-Cloud Environments
Flexera's 2024 State of the Cloud report found that 89% of organizations use multi-cloud. Yet native monitoring tools from AWS, Azure, and Google Cloud each cover only their own services.
That leaves teams manually reconciling data across three separate dashboards. Cross-cloud waste goes undetected, and anomalies that only appear in aggregate stay invisible. No single native tool surfaces a unified picture of storage utilization across providers.
Alert Fatigue and Threshold Tuning
Poorly configured monitoring creates more noise than signal. Without proper threshold calibration, teams face:
- Alerts on non-critical metrics that fire constantly
- No prioritization between warning-level and critical-level signals
- Engineers who stop responding to alerts because the signal-to-noise ratio is too low
The fix isn't more alerts—it's tiered alerts tied to context. A capacity warning at 70% should trigger a different response than an error rate spike, and both should come with defined next steps. Alerting on anomalies relative to historical baselines catches problems that static thresholds miss on their own.
Inability to Shrink Storage Autonomously
This is a structural limitation that monitoring alone cannot solve. All three major cloud providers make shrinking block storage a manual, risk-prone process:
- AWS EBS: You cannot decrease volume size in place—the workaround requires creating a new smaller volume and migrating data
- Azure Managed Disks: Downsizing isn't supported due to data-loss risk; migration to a smaller disk is required
- Google Persistent Disk: No in-place reduction; requires creating a smaller disk and migrating data
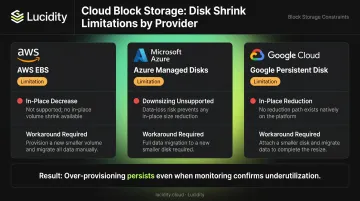
Monitoring may reveal that a volume is operating at 20% utilization, but acting on that insight requires manual migration that most teams defer indefinitely. Visibility without an action path means over-provisioning persists even when the evidence is clear.
Lucidity's AutoScaler handles both expansion and shrinking autonomously—no downtime, no manual migration. Dometic reduced cloud storage spend by 52% using this approach, without any operational overhead.
Cloud Storage Monitoring Best Practices
Start with Business Goals, Not Available Metrics
Before selecting metrics, identify what you're actually monitoring for:
- Uptime SLAs → monitor IOPS utilization, latency, and error rates
- Cost reduction targets → monitor capacity utilization, idle volumes, and egress
- Security compliance → monitor access patterns, error types, and configuration drift
The common mistake is tracking every available metric because it's available. Teams end up with dashboards full of data and no clear action path. Start with the business outcome, then select the two or three metrics that most directly indicate whether you're achieving it.
Centralize Multi-Cloud Storage into One View
Siloed dashboards by cloud provider create blind spots. Centralizing storage metrics from AWS, Azure, and Google Cloud into a single view enables:
- Cross-cloud utilization comparisons that reveal relative waste
- Unified cost tracking across providers
- Faster anomaly detection that doesn't require context-switching between tools
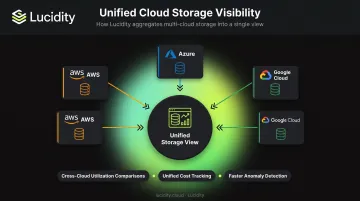
Lucidity provides real-time visibility across all three major cloud providers, giving enterprise teams a single platform to monitor their entire block storage estate rather than stitching together three separate native consoles.
Set Tiered, Actionable Alerts
Multi-level alert thresholds with documented runbooks work; generic "storage is getting full" notifications don't. A practical tiering structure:
- Warning (70% capacity) — review utilization trend, assess provisioning options
- Critical (85% capacity) — initiate expansion or right-sizing immediately
- Error rate spike — investigate access policies and application behavior
Each alert should answer the question "what do I do right now?" If it doesn't, it's noise. Pairing alerts with anomaly detection relative to historical baselines catches gradual degradation that threshold-based monitoring misses.
Automate Idle Resource Detection and Cleanup
Manual periodic reviews of idle volumes don't work at scale. Best practice is continuous, automated detection across all four idle disk states—unattached, unmounted, reserved, and zero-I/O—with defined remediation workflows.
FinOps Foundation's maturity framework identifies automated cleanup of idle resources as the "Run" maturity level, where waste is addressed with minimal manual intervention. Getting there requires:
- Continuous scanning (not monthly or quarterly audits)
- Automated flagging with full context—disk age, attachment history, usage patterns
- Defined workflows for each idle type: right-size, repurpose, or delete
- Auditable, reversible cleanup actions
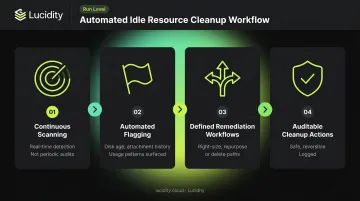
Lucidity's Lumen product executes this workflow with one-click cleanup actions that are safe, auditable, and reversible—with context including disk age, attachment state, and usage history to prevent accidental deletion.
Move Toward Autonomous Optimization
Monitoring tells you where waste exists. Acting on it automatically is where the real leverage is.
The FinOps Foundation's 2026 State of FinOps identifies waste reduction as the top current priority for FinOps teams, with AI use cases spanning anomaly detection, automated rightsizing, and faster alerting. IDC notes that AI workloads create more complex, less predictable cost behavior—which makes continuous automation a practical necessity, not a nice-to-have.
The direction that eliminates ongoing toil is systems that act, not just alert: expanding volumes approaching capacity before applications notice, shrinking over-provisioned volumes that monitoring confirms are underutilized, and eliminating idle storage continuously rather than reactively.
Lucidity AutoScaler operates as a NoOps, application-agnostic layer that expands, shrinks, and optimizes block storage in real time across AWS, Azure, and Google Cloud—without requiring infrastructure changes or manual intervention. Iron Mountain's Director of Operations described the shift directly: "We used to spend countless hours provisioning our cloud block storage. With Lucidity, we were able to automate our storage management and save significant cost on our annual block storage spend."
Frequently Asked Questions
What are the three parts of cloud monitoring?
Three pillars are commonly referenced:
- Performance monitoring — throughput, IOPS, and availability
- Reliability/availability monitoring — uptime and failure detection
- Cost/usage monitoring — resource consumption and spend
Cloud storage monitoring spans all three simultaneously.
Why am I getting cloud storage warnings?
Cloud storage warnings typically trigger when defined thresholds are breached—such as capacity nearing its limit, unusual error rates, unexpected access patterns, or idle resources flagged for review. Check your alert thresholds and confirm whether the warning relates to actual capacity, an I/O performance issue, or a cost anomaly.
What is the difference between cloud storage monitoring and general cloud monitoring?
General cloud monitoring covers compute, networking, applications, and storage collectively. Cloud storage monitoring focuses specifically on storage capacity, I/O performance, data access patterns, cost metrics, and idle or wasted volumes—with granularity that general tools don't provide.
What metrics matter most for cloud storage monitoring?
Five metrics consistently matter most: capacity utilization rate, IOPS and throughput, read/write error rates, idle and unattached volume count, and storage cost including egress fees.
How does cloud storage monitoring help reduce costs?
Monitoring surfaces over-provisioned, idle, and unattached storage resources that can be eliminated or right-sized. Continuous visibility into cost trends—including egress and request charges—allows teams to act before bills spike rather than investigating after the fact.
What is the difference between monitoring object storage and block storage?
Object storage (S3, GCS, Azure Blob) monitoring is relatively straightforward—bucket sizes and request rates are the primary signals. Block storage monitoring (EBS, Azure Disks, Persistent Disks) is considerably more complex: disk attachment status, IOPS utilization, and idle volume detection each require dedicated tracking. Block storage also carries higher waste risk because over-provisioned volumes are harder to right-size without downtime risk.