Introduction
Most engineering teams discover their cloud storage problem the same way: the monthly bill arrives, costs are up again, and nobody can explain why. Volumes provisioned months ago sit idle. Disks running at 30% capacity bill at 100%. And by the time anyone investigates, another billing cycle has already closed.
According to Flexera's 2025 State of the Cloud report, **84% of organizations struggle to manage cloud spend**, with budgets exceeding limits by 17% on average. Cloud storage overprovisioning — identified by Gartner as a primary cost driver — accounts for a significant share of that gap.
Cloud storage reporting is how teams fix this. It converts scattered infrastructure data into a clear picture of utilization, waste, and actionable next steps — giving engineers and FinOps teams the visibility they need to stop overpaying. This guide covers the metrics that matter, how the reporting process works, and how to turn findings into measurable cost reductions.
Key Takeaways
- Cloud storage reporting means collecting and analyzing metrics about storage consumption, performance, and cost across your cloud environment
- Without it, teams routinely overprovision — organizations waste over 50% of provisioned storage capacity on average
- The five metrics that matter most: utilization rate, idle volumes, cost per GB, I/O activity, and growth trends
- Effective reporting follows a six-step cycle: define objectives, connect sources, collect data, analyze findings, interpret results, and act
- Platforms like Lucidity eliminate manual effort with real-time multi-cloud visibility and autonomous optimization
What Is Cloud Storage Reporting?
Cloud storage reporting is the systematic practice of capturing, aggregating, and interpreting metrics about storage consumption, performance, and cost across cloud environments. For most enterprises, this means block storage — AWS EBS, Azure Managed Disks, and GCP Persistent Disk — though the principles extend to object and file storage as well.
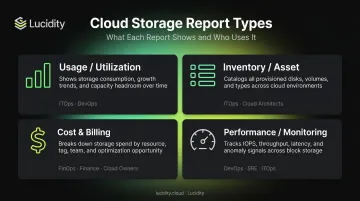
The Four Report Types
Different teams need different views of the same data:
| Report Type | What It Shows | Primary Users |
|---|---|---|
| Usage/Utilization | Provisioned vs. used capacity per volume | ITOps, DevOps |
| Inventory/Asset | Full catalog of storage resources and their states | ITOps, FinOps |
| Cost & Billing | Spend by volume, account, region, and tier | FinOps |
| Performance/Monitoring | I/O throughput, IOPS, latency against provisioned limits | DevOps, SRE |
The Multi-Cloud Problem
Organizations running workloads across AWS, Azure, and GCP face fragmented visibility by default. AWS Cost Explorer, Azure Cost Management, and GCP Cloud Billing Reports each provide solid data — but only for their own environment. Research from Flexera shows that 89% of organizations now use multi-cloud, yet native tools don't communicate across providers.
That gap leaves FinOps and ITOps teams manually reconciling reports from three separate consoles — often in spreadsheets.
Reactive vs. Proactive Reporting
That fragmentation is part of why most teams default to reactive reporting — reviewing past usage after costs have already occurred. It's better than nothing, but waste has already accumulated by the time anyone acts.
Proactive reporting monitors live utilization and triggers alerts before costs spike. For teams managing significant storage spend, real-time visibility means catching an over-provisioned volume in week one rather than discovering it on the monthly bill.
Key Metrics Every Team Should Track in Cloud Storage Reports
Storage Utilization Rate
Utilization rate is the ratio of used storage to provisioned storage. A volume provisioned at 1 TB but consuming 300 GB has a 30% utilization rate — meaning 70% of its cost delivers no value.
Based on analysis of 600+ enterprise assessments covering 100+ PB of storage data, Lucidity consistently finds that the average enterprise runs at approximately 30% disk utilization. Every major cloud provider bills on provisioned capacity, not consumed capacity — AWS EBS, Azure Managed Disks, and GCP Persistent Disk all charge for the full provisioned size regardless of how much data is actually stored.
Idle and Unattached Volumes
Storage volumes continue billing even when no workload touches them. There are four categories worth tracking separately:
- Unattached volumes — no VM or instance connected; AWS Compute Optimizer flags these after a 32-day lookback period, GCP's Active Assist identifies Persistent Disks unattached for 15+ days
- Reserved but unmounted volumes — allocated but never mounted to an active filesystem
- Zero-I/O volumes — attached to a running instance but generating no read/write activity for weeks
- Snapshot-only volumes — original disk retained after snapshotting, serving no active function
Identifying all four types is essential for eliminating silent spend. Standard cloud console recommendations typically surface only the most obvious cases.
Cost Per GB and Billing Breakdown
Tracking per-volume, per-account, and per-region cost data is where waste becomes specific enough to act on. A few reference points from official pricing:
- AWS EBS gp3: $0.08/GB-month; gp2: $0.10/GB-month; io2: $0.125/GB-month
- Azure Premium SSD v2 (East US): $0.081/GiB
- GCP SSD Persistent Disk (us-central1): approximately $0.17/GiB-month (calculated from hourly rate)
Watch for storage class mismatches — high-performance, high-cost volumes sitting on data that hasn't been accessed in months.
Console tooling helps narrow this down: AWS Cost Explorer supports filtering by EBS usage type groups, and Azure Cost Management allows grouping by individual resource or using the cm-resource-parent tag to link disks to their parent VMs.
I/O Performance Metrics
Tracking read/write throughput and IOPS against provisioned limits serves two purposes:
- Over-provisioning detection — flags high-performance volumes consuming premium pricing for workloads that don't need it
- Under-provisioning early warning — catches volumes approaching capacity limits before they cause a performance incident
Each major cloud provider exposes these metrics natively. AWS CloudWatch delivers EBS metrics at 1-minute granularity. Azure Monitor provides IOPS Consumed Percentage and Queue Depth. GCP Cloud Monitoring covers Persistent Disk latency and queue depth.
Storage Growth Trends and Forecasting
Historical growth data is the foundation of accurate capacity planning. Without it, teams either overprovision to avoid disk-full events or underprovision and risk downtime.
Trend analysis on monthly growth curves enables 6- and 12-month capacity modeling grounded in real consumption patterns. A useful forecast report typically includes:
- Month-over-month growth rate per volume or account
- Projected time-to-full for volumes on current trajectories
- Cost impact of current growth rate vs. right-sized provisioning
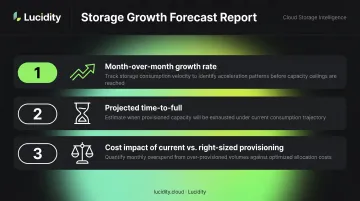
Teams that build this visibility reduce both unplanned disk-full incidents and the reflexive overprovisioning that inflates storage bills quarter after quarter.
How Cloud Storage Reporting Works: Step by Step
Effective cloud storage reporting isn't a one-time dashboard pull. It's an ongoing cycle that only delivers value when it closes the loop into action. The most common failure point is stopping at the report itself.
Step 1: Define Your Reporting Objectives
Start by clarifying what you're solving for. The objective determines which metrics matter and how granular the report needs to be:
- Cost optimization → focus on utilization rate, idle volumes, billing breakdown
- Compliance audit → focus on inventory completeness and data classification
- Capacity planning → focus on growth trends and forecasting
- Performance investigation → focus on I/O metrics and throughput
Scope decisions follow from the objective: per-volume, per-account, per-region, or org-wide.
Step 2: Connect and Enable Data Sources
Each major cloud provider requires specific setup:
- AWS: Enable Cost Explorer in your management account; configure CloudWatch for EBS metrics; activate Compute Optimizer for idle and right-sizing recommendations. IAM policies need
GetMetricDataandListMetricspermissions for CloudWatch; Cost Explorer access is controlled separately through management account IAM. - Azure: Use Azure Monitor for disk performance metrics (Monitoring Reader role); Azure Cost Management for billing data (Cost Management Reader role at subscription or resource group scope).
- GCP: Cloud Monitoring for Persistent Disk metrics; Cloud Billing Reports for cost data; Active Assist/Recommender for idle disk identification. Cloud Billing IAM roles control cost visibility.
For multi-cloud environments, you'll need to aggregate these sources into a unified view before any cross-environment analysis is possible.
Step 3: Collect and Organize Storage Data
Raw data from three providers in three formats isn't useful until it's standardized. Key tasks:
- Map volume IDs to workloads — connect disk identifiers to application owners or service names
- Enforce resource tagging — poor tagging is the single biggest reason storage reports fail to produce actionable findings
- Filter noise — exclude short-lived test volumes, ephemeral disks, and resources below meaningful cost thresholds
Step 4: Apply Analysis to Surface Insights
Convert raw data into findings using these analytical approaches:
- Utilization rate calculations across volume cohorts (by account, region, or team)
- Trend analysis on growth curves to identify accelerating spend
- Idle volume identification by cross-referencing attachment status with I/O logs
- Cost-to-utilization ratio to rank which optimizations will deliver the highest savings first
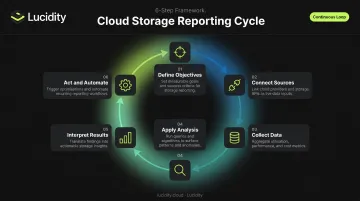
Step 5: Interpret Results and Prioritize Actions
Not all findings carry the same urgency. A 10 TB unattached volume in a production account demands different treatment than a 100 GB zero-I/O volume in a development environment.
Involve both FinOps and DevOps stakeholders before acting. Some volumes are idle for legitimate reasons:
- Warm standby or disaster recovery configurations
- Scheduled batch processes with long idle windows
- Reserved capacity for anticipated demand spikes
A volume idle for 45 days might be intentional infrastructure. Always verify context before deletion.
Step 6: Act, Automate, and Review
The action phase covers four moves:
- Delete confirmed idle resources with no legitimate operational purpose
- Right-size over-provisioned volumes to match actual workload patterns
- Adjust storage class assignments where tier mismatches are identified
- Set automated alerts for anomalies — new idle volumes, utilization drops, unexpected cost spikes
The reporting cycle should repeat on a defined cadence — weekly monitoring for real-time anomalies, monthly reviews for cost and utilization trends. Without automated alerting and scheduled reviews, findings pile up faster than teams can act on them — and the optimization value erodes quickly.
Turning Cloud Storage Reports into Cost Savings: A Practical Walkthrough
The Scenario
A mid-sized enterprise running mixed workloads across AWS and Azure notices cloud storage costs have increased quarter-over-quarter with no corresponding growth in active workloads. The FinOps team decides to run a comprehensive cloud storage utilization report for the first time.
Discovery Phase
The report spans 400+ EBS volumes and Azure Managed Disks — and the findings are typical of what most enterprises uncover on a first pass:
- Average utilization: ~35% — consistent with what Lucidity observes across enterprise environments before optimization
- Unattached volumes sitting idle for 30+ days — each still billing at full provisioned cost
- A cluster of attached volumes with zero I/O activity for 60+ days
The underlying billing principle explains why this is so costly: AWS charges for every provisioned GB-month whether the storage is used or not. Azure bills for the provisioned disk tier, not consumed bytes. Every idle volume is a full-price line item.
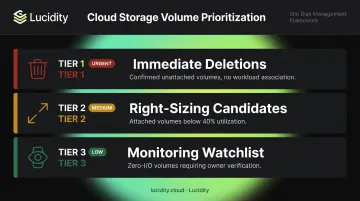
Analysis and Prioritization
With volumes already tagged by owner and environment, the team segments findings into three tiers:
- Tier 1 — Immediate deletions: Confirmed unattached volumes with no snapshots and no recent workload association
- Tier 2 — Right-sizing candidates: Attached volumes running below 40% utilization
- Tier 3 — Monitoring watchlist: Zero-I/O volumes requiring owner verification before action (potential warm standby or DR configurations)
Action and Outcome
The team acts on Tier 1 deletions and right-sizes Tier 2 volumes over a two-week window. Typical outcomes from this kind of structured cleanup:
- 15–40% reduction in block storage spend depending on the degree of prior overprovisioning
- 100+ engineering hours reclaimed from manual investigation and ticket triage
- Dometic, a Lucidity customer, achieved a documented 52% reduction in cloud storage spend
The Key Lesson
The one-time cleanup is only half the story. Establishing a recurring reporting cadence and alerting thresholds ensures idle volumes don't accumulate again — without that, overprovisioning quietly rebuilds over the next two quarters. Automation catches waste as it emerges rather than waiting for the next billing spike to surface it.
How Lucidity Can Help
Most cloud storage waste doesn't show up in native dashboards. AWS Cost Explorer, Azure Cost Management, and GCP Cloud Billing Reports each cover their own environment — but reconciling them across accounts and regions is a manual process that few teams have bandwidth for.
Lucidity is purpose-built for cloud block storage visibility and optimization. Its Lumen product provides unified, real-time visibility into every EBS volume, Azure Disk, and GCP Persistent Disk from a single interface — no infrastructure changes, no agent installations, no code modifications required.
The platform doesn't stop at surfacing data. Lucidity identifies all four categories of idle disks — unattached, reserved, unmounted, and zero-I/O — with full context on each: disk age, attachment state, usage history, and cost trends.
Recommendations are backed by historical data, not point-in-time snapshots. Cleanup is one-click, auditable, and reversible.
Beyond idle disk cleanup, Lucidity's AutoScaler autonomously expands and shrinks storage volumes with zero downtime as workload demands change — eliminating the performance tax and operational risk that come with manual resizing.
The results across Lucidity's enterprise customer base are measurable:
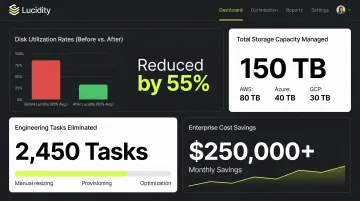
- ~30% average disk utilization before optimization, rising to 75% after
- 15+ petabytes of storage capacity optimized across customer environments
- 517,000+ manual SRE tasks eliminated for engineering teams
- Customers like Iron Mountain, Dometic, and World Market have cut storage spend by up to 70%
Lucidity is SOC 2 compliant, FinOps Foundation certified, and named a 2025 Gartner Cool Vendor in Data Protection and Storage — with no infrastructure changes required to get started.
Frequently Asked Questions
Where do I find my cloud storage information?
Each major provider has a native console: AWS offers Cost Explorer and CloudWatch for EBS data, Azure provides Monitor and Cost Management for disk insights, and GCP has Cloud Billing Reports and Cloud Monitoring for Persistent Disk metrics. For unified multi-cloud visibility without manual reconciliation, platforms like Lucidity aggregate all of these sources in one interface.
What is a cloud report?
A cloud report is a structured summary of cloud resource usage, performance, and cost over a defined time period. For storage specifically, cloud reports show how much storage is provisioned versus used, what it costs broken down by volume or account, and where inefficiencies exist.
Are cloud storage alerts legitimate?
Legitimate alerts come from AWS CloudWatch, Azure Monitor, GCP Cloud Monitoring, or authorized third-party platforms connected to your environment. Any alert from an unknown source requesting credentials or payment should be verified directly through your cloud console.
What metrics should I track in cloud storage reports?
The five most important: storage utilization rate, idle and unattached volume count, cost per GB by account and region, I/O throughput versus provisioned limits, and storage growth trends over time.
How often should cloud storage reports be reviewed?
Run cost and utilization reviews at minimum monthly, with real-time alerts for performance anomalies and new idle volumes. Large or dynamic environments benefit most from continuous automated monitoring.
How do I reduce cloud storage costs using reporting data?
Start by identifying and deleting confirmed idle volumes, then right-size over-provisioned volumes to match actual workload needs. Set automated alerts to catch new inefficiencies before the next billing cycle — Dometic cut their block storage spend by 52% doing exactly this.