This guide covers exactly what you need to audit your Azure disk estate: the tools and permissions required, how to identify both capacity waste and IOPS-based over-provisioning, and how to interpret utilization data so you can act on it confidently.
Key Takeaways
- Azure bills on provisioned disk size and tier — over-provisioning is common and a leading source of wasted cloud spend
- Key waste signals: high free space relative to provisioned capacity, and low actual IOPS vs. provisioned IOPS
- Audit methods covered: Azure Portal (Cost Analysis), Azure Monitor Metrics, and Azure CLI/PowerShell
- Always use 30–90 day averaged metrics — point-in-time snapshots are skewed by backup jobs and disk bursting
- Right-sizing options: downsize disk tiers, switch to Standard, or migrate to Premium SSD v2
What You Need Before You Start
Auditing Azure disk utilization without the right access leads to incomplete visibility. Sort these out before pulling any data.
Tools and Access Required
| Tool | Purpose |
|---|---|
| Azure Portal (Cost Analysis + Disks blade) | Spend visibility and disk state filtering |
| Azure Monitor | Disk metrics: Data Disk IOPS Consumed Percentage, Data Disk Read/Write Bytes/sec |
| Azure CLI or PowerShell | At-scale disk inventory queries across subscriptions |
| Log Analytics workspace | OS-level disk space analysis via the Perf table (optional, but recommended for OS-level analysis) |
Minimum permissions needed:
- Reader or Contributor on the subscription or resource group
- Cost Management Reader for cost data access
- Monitoring Reader for Azure Monitor metrics and logs
Preconditions and Setup
Once your tools and access are confirmed, check that you're working with managed disks, not legacy unmanaged VHD-based disks — the billing model and identification process differ. Microsoft documents five managed disk types: Ultra Disk, Premium SSD v2, Premium SSD, Standard SSD, and Standard HDD. Each has a different performance-to-cost relationship, which changes how "over-provisioned" is defined for that tier.
Before pulling any metrics, set your monitoring window to 30–90 days. Single-day readings are skewed by backup jobs, patching cycles, and disk bursting behavior. A 90-day lookback captures both baseline and peak usage patterns, giving you a reliable basis for any right-sizing decision.
Four Types of Over-Provisioning in Azure Managed Disks
Over-provisioning isn't one condition. It shows up in different forms, each requiring a different lens to catch. Lucidity's Lumen product categorizes disk waste into four types — unattached, reserved, unmounted, and zero-I/O — covering both capacity and activity-based waste that don't surface in native cloud dashboards.
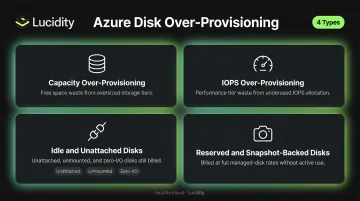
Capacity Over-Provisioning (Free Space Waste)
The most common form. Disks are provisioned at a larger size tier than the workload requires, leaving a large percentage of free space permanently unused.
Premium SSD sizes are fixed in preset tiers — P10 = 128 GiB, P20 = 512 GiB, P30 = 1,024 GiB, P40 = 2,048 GiB. Even a slight overshoot forces you into the next tier, and you pay for all unused capacity. A SQL workload using 80 GiB on a P30 (1 TiB) is paying for more than 12x the storage it needs.
IOPS Over-Provisioning (Performance Tier Waste)
Premium disk tiers bundle IOPS with capacity — you pay for maximum provisioned IOPS whether or not you use them. A disk running at a fraction of its provisioned IOPS ceiling doesn't need a Premium tier. This is often the larger hidden cost: the disk is attached and active, so it doesn't show up in unattached disk reports, but the performance tier is pure waste.
Idle and Unattached Disks
Three sub-categories here:
- Unattached — disk not attached to any running VM; full cost, zero output
- Unmounted — disk attached to a VM but not mounted within the OS; invisible to most audits
- Zero-I/O — disk attached and mounted but showing no meaningful read/write activity over an extended period
These represent the clearest waste signal: provisioned capacity delivering nothing.
Reserved and Snapshot-Backed Disks
Activity-based waste isn't the only category that goes unnoticed. Disks retained solely for snapshot or backup purposes but billed at full managed-disk rates are candidates for conversion to cheaper snapshot storage or Azure Backup, depending on recovery time requirements. The cost differential between a full managed disk and snapshot storage can be significant at scale.
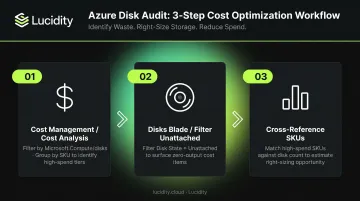
Three Methods to Identify Over-Provisioned Azure Disks
Each method suits different team roles and environments. Start with the portal for initial scoping, use Monitor metrics for utilization analysis, and use CLI/PowerShell when working at scale.
Method 1: Azure Portal and Cost Analysis
Best for: Initial scoping, stakeholder communication, unattached disk identification.
Steps:
Navigate to Cost Management > Cost Analysis. Filter by resource type
Microsoft.Compute/disksand group by SKU or resource. This shows spend distribution across disk tiers. A P30 or P40 cluster with many disks is your first investigation target.Navigate to Azure Portal > Disks. Filter by Disk State = Unattached. Every disk in this list is incurring cost with no active workload attached. These are immediate savings candidates requiring no further analysis.
Cross-reference high-spend SKUs against disk count to estimate right-sizing opportunity size before committing to deeper analysis.
Limitations: No per-disk utilization data. You can see spend and disk state, but not actual bytes used or IOPS consumed. Use this for first-pass triage only, not a complete audit.
Method 2: Azure Monitor Metrics
Best for: Capacity and IOPS utilization analysis; identifying moderately over-provisioned attached disks.
Steps:
In Azure Portal, navigate to a VM or disk resource > Monitoring > Metrics. Select
Data Disk IOPS Consumed Percentagefor IOPS utilization. Set time range to 30–90 days and use Average aggregation — not Max.For OS-level disk space, use Azure Monitor Agent with a Data Collection Rule to send
LogicalDisk % Free Spacecounters to Log Analytics. Query thePerftable filtered toLogicalDiskcounters, summarized by computer and disk instance. Calculate: flag any disk with consistently more than 50% free space.For IOPS analysis: disks consistently below 20–25% of provisioned IOPS over 90 days are strong candidates for tier downgrade or migration to Standard.
Note on disk bursting: Premium SSD and Standard SSD disks support bursting: credit-based for P20 and smaller (free), on-demand for P30+ (additional charges). Bursting allows short-duration spikes beyond provisioned limits, which can make a disk appear highly utilized on peak days. Using 30–90 day averages filters out these spikes and surfaces genuine underutilization.
Limitations: OS-level disk space data requires Azure Monitor Agent installed on each VM. Analyzing many disks requires Log Analytics queries rather than manual metric inspection.
Method 3: Azure CLI and PowerShell
Best for: Large disk estates; automated recurring audits; exportable inventory for FinOps reporting.
CLI commands:
# Find unattached disks using the managedBy property
az disk list --query '[?managedBy==`null`]' -o table

# Export full disk inventory for analysis
az disk list -o table
PowerShell:
# Find unattached disks
Get-AzDisk | Where-Object {$_.ManagedBy -eq $null}

# Export for reporting
Get-AzDisk | Where-Object {$_.ManagedBy -eq $null} | Export-Csv -Path "unattached_disks.csv"
The disk list output exposes diskSizeGB, sku.name, sku.tier, and diskState, giving you enough to build a complete inventory. Layer in Azure Monitor REST API or Log Analytics queries to join those disk properties with average IOPS and throughput metrics, producing a full right-sizing analysis.
Limitations: Requires scripting familiarity. OS-level free space data still requires Azure Monitor Agent layered on top; CLI alone can't tell you how much space is actually used inside the OS.
How to Interpret Your Disk Utilization Data
Pulling the data is step one. Acting on misread data — downsizing a disk that legitimately bursts on peak days — causes performance degradation or application downtime. Here's how to read what the numbers actually mean.
Utilization Thresholds and Recommended Actions
| Utilization State | Signals | Action |
|---|---|---|
| Well-utilized | Space: 60–80% used; IOPS avg >40–50% | Document baseline, review in 90 days |
| Moderately over-provisioned | Free space: 30–50%; IOPS avg: 15–40% | Evaluate downsizing to next lower tier (e.g., P30 → P20) or Premium SSD v2 migration |
| Severely over-provisioned or idle | Free space >50% over 90-day avg; IOPS avg <15%; or Disk State = Unattached | Downsize tier, migrate to Standard SSD/HDD, or delete after team validation |
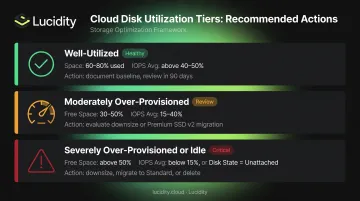
The "moderately over-provisioned" row often points to a Premium SSD v2 migration rather than a straight downsize. Unlike Premium SSD v1's fixed tier steps, Premium SSD v2 allows granular GiB-level sizing with independently configurable IOPS and throughput — removing the forced tier jumps responsible for most capacity waste in v1.
For teams managing large Azure environments, waste accumulates between manual audit cycles — and periodic reviews rarely catch it fast enough. Lucidity's Lumen product addresses this by continuously surfacing all four idle disk categories (unattached, reserved, unmounted, and zero-I/O), with visibility into disk age, attachment state, and usage history. Tiering recommendations are backed by historical IOPS, throughput, and cost trends rather than single-point-in-time reads.
Common Mistakes When Auditing Azure Disk Utilization
Most Azure disk audits fail not because of missing data, but because of how that data gets interpreted. These three mistakes account for the majority of wasted spend that slips through the cracks.
Using point-in-time metrics. A single day's IOPS reading can be dominated by a backup job, a patching cycle, or end-of-month batch processing. Premium SSD disks support credit-based bursting, so a disk can look fully utilized on any peak day even if its 90-day average sits well below 20%. Always use 30–90 day averages before making any right-sizing decision.
Stopping at unattached disks. Unattached disks are easy to find and rightfully get attention. But the larger hidden cost is often attached disks running at a fraction of their provisioned IOPS ceiling — paying for Premium P30 performance when the workload only needs Standard SSD. An audit that stops at disk state misses most of the savings opportunity.
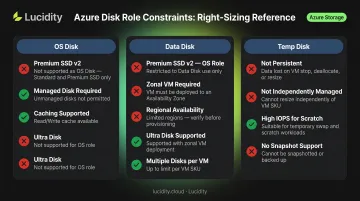
Treating OS disks, data disks, and temp disks the same. These have different right-sizing constraints that matter at execution time. Applying identical migration actions across disk roles leads to failed migrations or misapplied recommendations. Key constraints to track:
- Premium SSD v2 cannot be used as an OS disk
- It requires zonal VM deployment in availability zone-enabled regions
- It isn't available in all Azure regions
Frequently Asked Questions
What are the different types of Azure managed disks?
Azure offers five managed disk types: Ultra Disk, Premium SSD v2, Premium SSD, Standard SSD, and Standard HDD. Each tier delivers different performance levels at different price points — choosing between them is one of the primary levers for storage cost optimization.
What are the limitations of Premium SSD v2?
Premium SSD v2 cannot be used as an OS disk and is only deployable on zonal VMs in regions that support availability zones. Regional availability is also limited — check current region support before planning migrations. For eligible data disks, it offers greater IOPS and throughput flexibility than Premium SSD v1.
How do I downsize an Azure managed disk after identifying over-provisioning?
Azure does not support in-place disk shrinking. The process requires creating a new smaller disk, copying data using a tool like Robocopy or az disk, reattaching the new disk, and deleting the original. Dependent services may need to be stopped temporarily during the migration.
What is a healthy disk utilization percentage for Azure managed disks?
A reasonable target is 60–80% space utilization (keeping 20–30% as headroom) and IOPS Consumed Percentage consistently above 40% on average. Disks regularly below these thresholds are candidates for right-sizing.
Can over-provisioned Azure disks be resized without downtime?
Expanding a managed disk is supported online for eligible disk types without downtime. Shrinking is not supported in place — it always requires creating a new disk and migrating data. Tools that monitor utilization continuously help catch over-provisioned disks before a full migration is needed.
How often should I audit Azure disk utilization?
Run a formal review every 30–90 days to account for workload seasonality. Pair that with continuous monitoring to catch newly unattached or zero-I/O disks before they accumulate meaningful cost between scheduled reviews.