Introduction
Azure managed disk costs have a structural billing problem: storage provisioned for workloads that shrank, VMs that were decommissioned, or peak loads that never arrived keeps billing month after month. There's no native alert when a disk goes unwritten for 90 days, no automatic flag when a Premium SSD is doing Standard SSD-level work.
Lucidity's research across 600+ enterprise assessments and over 100 petabytes of storage data found that the average enterprise runs at 30% disk utilization — paying for three times the capacity actually in use. At scale, this translates to the kind of structural waste that Lucidity estimates will reach $21.5 billion in wasted cloud block storage spend by 2028.
The good news: the waste is findable and fixable. This guide walks through a structured, repeatable approach to Azure storage waste assessment: from scoping and inventory through capacity analysis, prioritization, and ongoing monitoring.
Key Takeaways
- Azure storage waste assessment identifies idle, over-provisioned, and misclassified managed disks across your environment
- Target four waste types: unattached disks, over-provisioned disks, unmounted volumes, and zero-I/O disks
- Average enterprise disk utilization sits around 30% — most organizations pay for far more than they use
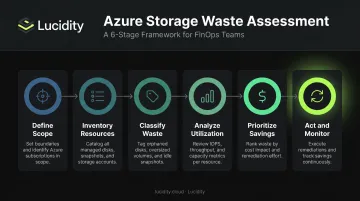
- A structured assessment covers six stages — scope, inventory, waste classification, capacity analysis, prioritization, and optimization
- Automation converts this from a one-time audit into a continuous process
What Is Azure Storage Waste Assessment and Capacity Analysis?
Azure storage waste assessment is the systematic process of inventorying all Azure storage resources — primarily managed disks attached to virtual machines — to identify what's idle, over-provisioned, or mismatched with actual workload demands.
Two related but distinct activities define this work:
- Waste assessment answers: What storage am I paying for that I don't need?
- Capacity analysis answers: Of the storage I'm using, how much is actually being consumed versus provisioned?
Running only one without the other leaves money on the table. Waste assessment without capacity analysis misses over-provisioned disks that are attached and "in use" but running at 20% fill. Capacity analysis without waste assessment ignores disks that aren't attached at all.
Together, these two lenses give a complete picture of where Azure storage spend is justified — and where it isn't.
What Azure Storage Types Are in Scope?
This process applies primarily to Azure managed disks — the block storage volumes backing virtual machines. That includes:
- Premium SSD (P-series) — highest performance, highest cost
- Standard SSD (E-series) — balanced performance and price
- Standard HDD (S-series) — lowest cost, lowest performance
Unmanaged disks and storage accounts (blobs, files, queues, tables) aren't the focus here — block storage managed disks drive the majority of addressable waste in most enterprise Azure environments.
Why Azure Storage Waste Assessment Matters
The Structural Over-Provisioning Problem
Teams provision storage buffers for peak demand and rarely revisit them. The reason is straightforward: expanding a managed disk in Azure is easy. Shrinking one is not.
Microsoft's own documentation confirms that directly downsizing an Azure data disk is unsupported. The documented workaround requires creating a smaller disk, copying data, detaching the original, and deleting it — a migration project, not a configuration change. That friction means teams leave over-provisioned disks alone indefinitely, even after workloads shrink or move.
Over time, that inertia turns into a measurable cost problem.
The Financial Compounding Effect
Azure managed disk pricing is tier-based and billed hourly against provisioned size — not consumed space. A 1TB Premium SSD (P30) costs $135.17/month in East US whether it holds 50GB of data or 950GB.
Switch that same disk to a Standard SSD (E30) and the monthly cost drops to $76.80, a 43% reduction with no changes to the underlying data. Across dozens or hundreds of over-provisioned disks, those per-disk savings add up to five- or six-figure annual reductions for most enterprise environments.
| SKU Change (East US, LRS) | Monthly Saving | % Reduction |
|---|---|---|
| P10 → E10 (128 GiB) | $10.11 | 51.3% |
| P20 → E20 (512 GiB) | $34.82 | 47.6% |
| P30 → E30 (1024 GiB) | $58.37 | 43.2% |
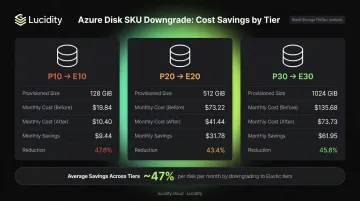
Source: Azure Managed Disks pricing, East US, retrieved June 2026
Capacity Analysis as a Reliability Practice
The financial case is clear, but cost isn't the only reason to run a capacity assessment. Teams without visibility into actual disk utilization face two compounding risks:
- Over-provisioning: paying for unused capacity indefinitely
- Under-provisioning: running disks close to full and risking disk-full failures and unplanned downtime
Lucidity's assessment data shows that 8-10% of enterprise disks are at downtime risk at any given time. Most infrastructure teams have no visibility into which specific disks are in that range until something breaks.
How Azure Storage Waste Assessment Works – Step by Step
Most teams either skip formal assessment entirely or run a one-time audit and never follow up. The six-stage process below is designed to be repeatable — not just a cleanup exercise.
Step 1 – Define Scope and Objectives
Before pulling any data, define what's in scope:
- Which Azure subscriptions and resource groups?
- Which regions?
- Managed disks only, or storage accounts too?
- What's the utilization threshold that flags a disk as a rightsizing candidate? (A common starting point: disks using less than 50% of provisioned capacity over a 30-day window)
Setting clear scope prevents scope creep and gives stakeholders a defined success metric.
Step 2 – Inventory All Azure Storage Resources
Collect a complete picture of every managed disk, including:
- Disk name, SKU, and provisioned size
- Attachment state — attached to a VM, or unattached?
- Associated VM (if attached)
- Creation date and last-modified timestamp
- Subscription and resource group
Tools for inventory:
- Azure Resource Graph — supports Kusto queries across subscriptions to pull disk inventory at scale
- Azure Cost Management and the Cost Optimization Workbook — surfaces unattached managed disks and snapshot costs
- Third-party platforms (like Lucidity) — provide cross-subscription visibility with waste pre-classified
The Azure Cost Optimization Workbook includes a dedicated "Unattached Managed Disks" query and excludes disks reserved for Azure Site Recovery — a useful filter that reduces false positives from the start.
Step 3 – Classify Waste by Type
Once you have inventory, categorize each disk into one of four waste types:
| Waste Category | Description |
|---|---|
| Unattached disks | Provisioned but not connected to any VM |
| Over-provisioned disks | Attached, but significantly larger or higher-SKU than workload requires |
| Unmounted volumes | Attached to a VM, but not mounted in the OS |
| Zero-I/O disks | Attached and mounted, but no read/write activity over a defined period |
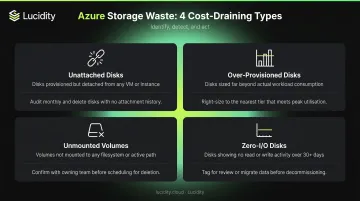
The common mistake is stopping at "unattached." Teams that only check attachment state miss the over-provisioned and zero-I/O categories — which often represent more dollars than the orphaned disks.
Step 4 – Analyze Actual Capacity Utilization
For attached disks, you need utilization data to identify rightsizing candidates. Azure Monitor exposes disk performance metrics at one-minute granularity for managed disks, including:
For attached disks, you need utilization data to identify rightsizing candidates. Azure Monitor exposes disk performance metrics at one-minute granularity for managed disks, including:
- Disk Read Bytes/sec
- Disk Write Bytes/sec
- Disk Read/Write Operations/sec
One caveat: Azure Monitor's microsoft.compute/disks metric namespace does not expose a "Disk Used Bytes" metric for managed disks. Filesystem-level used space requires guest-level data collection via Log Analytics or a monitoring agent.
The FinOps Foundation's guidance on Azure Managed Disks recommends comparing used versus available disk space and provisioned versus utilized IOPS over a representative period of at least three months. Disks showing consistently low IOPS against their provisioned tier are downgrade candidates.
Step 5 – Prioritize and Quantify Savings Opportunities
Rank findings by potential monthly savings:
- Unattached disks — delete or snapshot-and-delete for immediate savings with zero performance risk
- Over-provisioned Premium SSDs — downgrade SKU after validating IOPS and throughput requirements
- Zero-I/O disks — get application owner sign-off, then decommission or archive
- Unmounted volumes — coordinate with OS/app teams before removal
Build a savings estimate by multiplying wasted capacity by the per-GiB cost differential between current and target SKU. The pricing table above gives the raw deltas — apply them to your actual disk inventory for a concrete dollar figure.
Step 6 – Act, Automate, and Monitor Continuously
Execute in order of risk:
- Delete unattached disks after confirming no snapshot dependency — Azure provides a portal-based workflow for finding and deleting them
- Downgrade over-provisioned SKUs after performance validation — this is a lower-risk operation than resizing
- Decommission zero-I/O disks after application owner sign-off
Set up monitoring so disk attachment state and utilization are reviewed on a monthly cadence at minimum. Without automated alerts or scheduled reviews, new waste accumulates silently — automated tools like Lucidity's Lumen can flag idle and over-provisioned disks continuously, so the next assessment starts with current data rather than a stale snapshot.
Azure Storage Waste Assessment: A Practical Walkthrough
Consider a mid-size enterprise running approximately 200 Azure VMs across multiple subscriptions. Azure managed disk costs have grown 40% year-over-year with no corresponding workload growth — a clear sign that waste has been accumulating unchecked.
Discovery Phase
Using Azure Resource Graph queries against all subscriptions, the team inventories every managed disk. What they find:
- 38 disks with no attached VM — pure orphaned spend
- 22 disks with zero read/write I/O over 60 days
- 45 disks provisioned at Premium SSD where workload I/O patterns suggest Standard SSD would be sufficient
The zero-I/O and SKU-mismatch categories were invisible to the team's previous manual checks, which only filtered on attachment state. These findings set the stage for the next step: quantifying how much capacity is actually being used.
Capacity Analysis
For the 45 over-provisioned disks, average capacity utilization sits at 28% of provisioned size. For the 22 zero-I/O disks, none have been written to in over 90 days.
To estimate savings: if the 45 Premium SSD disks average a P20 (512 GiB), downsizing to Standard SSD E20 saves $34.82/disk/month — approximately $1,567/month across the group before accounting for the unattached and zero-I/O removals. The 38 unattached disks add further savings depending on their SKUs.
Prioritization and Action
The team sequences remediations by risk:
- Unattached disks are snapshotted (for a 30-day safety window), then deleted
- Zero-I/O disks are reviewed with application owners — 18 of 22 confirmed unused and decommissioned
- Premium SSD volumes are targeted for SKU downgrade after IOPS validation
For disks that are over-sized but not over-SKU'd, shrinking the volume requires the documented Microsoft workaround: create a smaller disk, copy data, detach the original, reattach the new one.
Across 45 disks, that's a multi-week project with workload-specific downtime risk on each one. Most teams stop here. The savings are real — but the manual effort to capture them is prohibitive.
Outcome
Even with the volume-shrink work deferred, the team captured meaningful savings through deletions and SKU downgrades alone. After the assessment cycle:
- Total managed disk spend reduced materially through deletion and SKU downgrades
- A monthly review cadence established using the Cost Optimization Workbook
- Alerts configured to flag new unattached disks after 14 days
Without automation, though, these waste patterns will return within a few provisioning cycles — the same orphaned disks, the same SKU mismatches, just on newer volumes.
How Lucidity Can Help
The practical walkthrough above exposes the core problem with manual Azure storage waste assessment: finding the waste is achievable, but acting on it — particularly rightsizing over-provisioned volumes — creates enough operational friction that most teams avoid it.
Lucidity's platform provides real-time visibility into every managed disk across Azure subscriptions, automatically classifies storage into all four waste categories (unattached, over-provisioned, unmounted, and zero-I/O), and surfaces evidence-backed recommendations with one-click execution through Lumen, its storage observability and optimization engine.
For the rightsizing problem specifically, AutoScaler autonomously expands and shrinks disk allocations based on actual workload demand, solving the operational complexity that makes manual shrink projects so difficult. Results across Lucidity's customer base include:
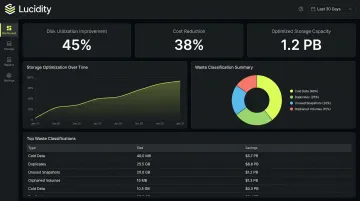
- Disk utilization increases from ~30% to 75% on average
- Up to 70% reduction in block storage costs
- Over 15 petabytes of cloud storage capacity optimized globally
The platform requires zero infrastructure changes and no code modifications — making it deployable by FinOps, ITOps, or DevOps teams without production risk. Lucidity holds SOC 2 compliance and FinOps Foundation certification, and was named a 2025 Gartner Cool Vendor in Data Protection and Storage.
Teams that want a quick baseline can start with Lucidity's free Assessment tool, which scans your Azure environment in under five minutes and surfaces utilization data, downtime risks, and potential savings — no agents, no setup, no commitment.
Frequently Asked Questions
What are the four types of Azure Storage?
Azure Storage accounts contain four service types: Blob Storage (unstructured objects), Azure Files (managed file shares), Azure Queues (message storage), and Azure Table Storage (NoSQL key-value data). Azure Managed Disks are a separate category (block-level storage volumes used by Azure VMs) and the primary source of cloud storage waste in most enterprise environments.
What is the difference between Azure ZRS and Azure GZRS?
ZRS (Zone-Redundant Storage) replicates data synchronously across three availability zones within a single region. GZRS (Geo-Zone-Redundant Storage) adds cross-region geo-replication on top of zone-level redundancy. Choosing the right redundancy tier matters for capacity planning — higher redundancy tiers carry higher per-GB costs, and many workloads don't require GZRS-level protection.
What are the five pillars of the Azure Well-Architected Framework?
The five pillars are Reliability, Security, Cost Optimization, Operational Excellence, and Performance Efficiency. Storage waste assessment maps directly to Cost Optimization (eliminating unused resources) and Operational Excellence (maintaining right-sized infrastructure) — both of which explicitly call for removing over-provisioned and idle resources.
What does SKU stand for in Azure?
SKU stands for Stock Keeping Unit. In Azure managed disks, it refers to the specific performance and redundancy tier — such as P30 LRS (Premium SSD, 1024 GiB, locally redundant) or E30 LRS (Standard SSD). Selecting a higher SKU than workloads require is one of the most common and costly forms of Azure storage waste, given the significant price differential between tiers.
How do I find unused Azure managed disks?
You can find unattached disks via the Azure Portal (filter by "Unattached" state), Azure Resource Graph queries, or the Azure Cost Optimization Workbook. Truly unused storage also includes attached disks with zero I/O activity, which require Azure Monitor metrics or Log Analytics data to detect — and manual audits frequently miss them.
What causes Azure storage waste?
The most common causes include:
- Over-provisioning storage buffers for demand peaks that never arrive
- Failing to delete disks when VMs are decommissioned
- Retaining snapshots beyond their useful life
- Avoiding rightsizing because shrinking Azure managed disks requires a data-copy migration, making remediation feel riskier than the waste itself