Last updated: July, 2026
tl;dr: Azure monitoring is no longer one tool. Most teams need a performance layer such as Azure Monitor or Dynatrace, an APM platform such as New Relic or AppDynamics, and a cost and storage optimization layer such as Lucidity. Customers using this combination cut Azure storage spend by 40 to 70 percent while catching performance issues before users notice.
Azure environments span more services than any single monitoring tool can cover well. A complete observability and operations practice on Azure now spans three layers: infrastructure performance, application performance, and cost and resource optimization. The right stack depends on which combination of those layers needs the most attention right now.
This guide compares 10 Azure monitoring tools across all three layers and highlights where each fits in a real production environment. Cost and storage visibility have moved from "nice to have" to "primary use case" for many Azure operations teams. Block storage in particular is routinely overprovisioned by 40 to 70 percent, and traditional monitoring tools see the symptom (low utilization) without acting on the cause. By the end of this guide, you will have a clear picture of which tools to combine for full Azure visibility, performance assurance, and cost control.
Benefits of Azure Monitoring Tools
Yoru Azure environment is dynamic. Therefore, you should constantly monitor the health and performance of your Azure infrastructure, apps, services, and other components to ensure optimal performance.
Some of the benefits of Azure monitoring tools are:
- Azure monitoring tools shows your resource usage trends to find ways to reduce your expenses.
- Azure monitoring tools help you find the underlying causes of abnormalities so you can address them before they become expensive issues.
- You can improve the dependencies, Azure infrastructure, and application performance using Azure monitoring tools by identifying and eliminating bottlenecks.
These are a few advantages of Azure Monitoring. You should leverage the best Azure monitoring tools to make the most of Azure services.
Top Azure Monitoring Tools
Several cloud monitoring and management tools offer features and advantages for monitoring integrations, including Azure Monitor, Lucidity, Turbo360, Dynatrace, Datadog, New Relic, and many more.
We've compiled a list of the top 10 Azure monitoring tools to help businesses track, analyze, and optimize resources and applications.
1. Lucidity - For Cloud Storage Optimization
Most Azure monitoring tools surface CPU, memory, network, and application metrics but treat storage as a static cost line Lucidity is the exception: it provides both insights into hidden Azure storage metrics, like Managed Disk utilization and tiering efficiency, and the ability to act autonomously to optimize those findings.
The Lucidity Platform offers several modules to optimize Azure storage:
- Disk Scaling autonomously rightsizes overprovisioned Azure Managed Disks across subscriptions, in real time, without downtime.
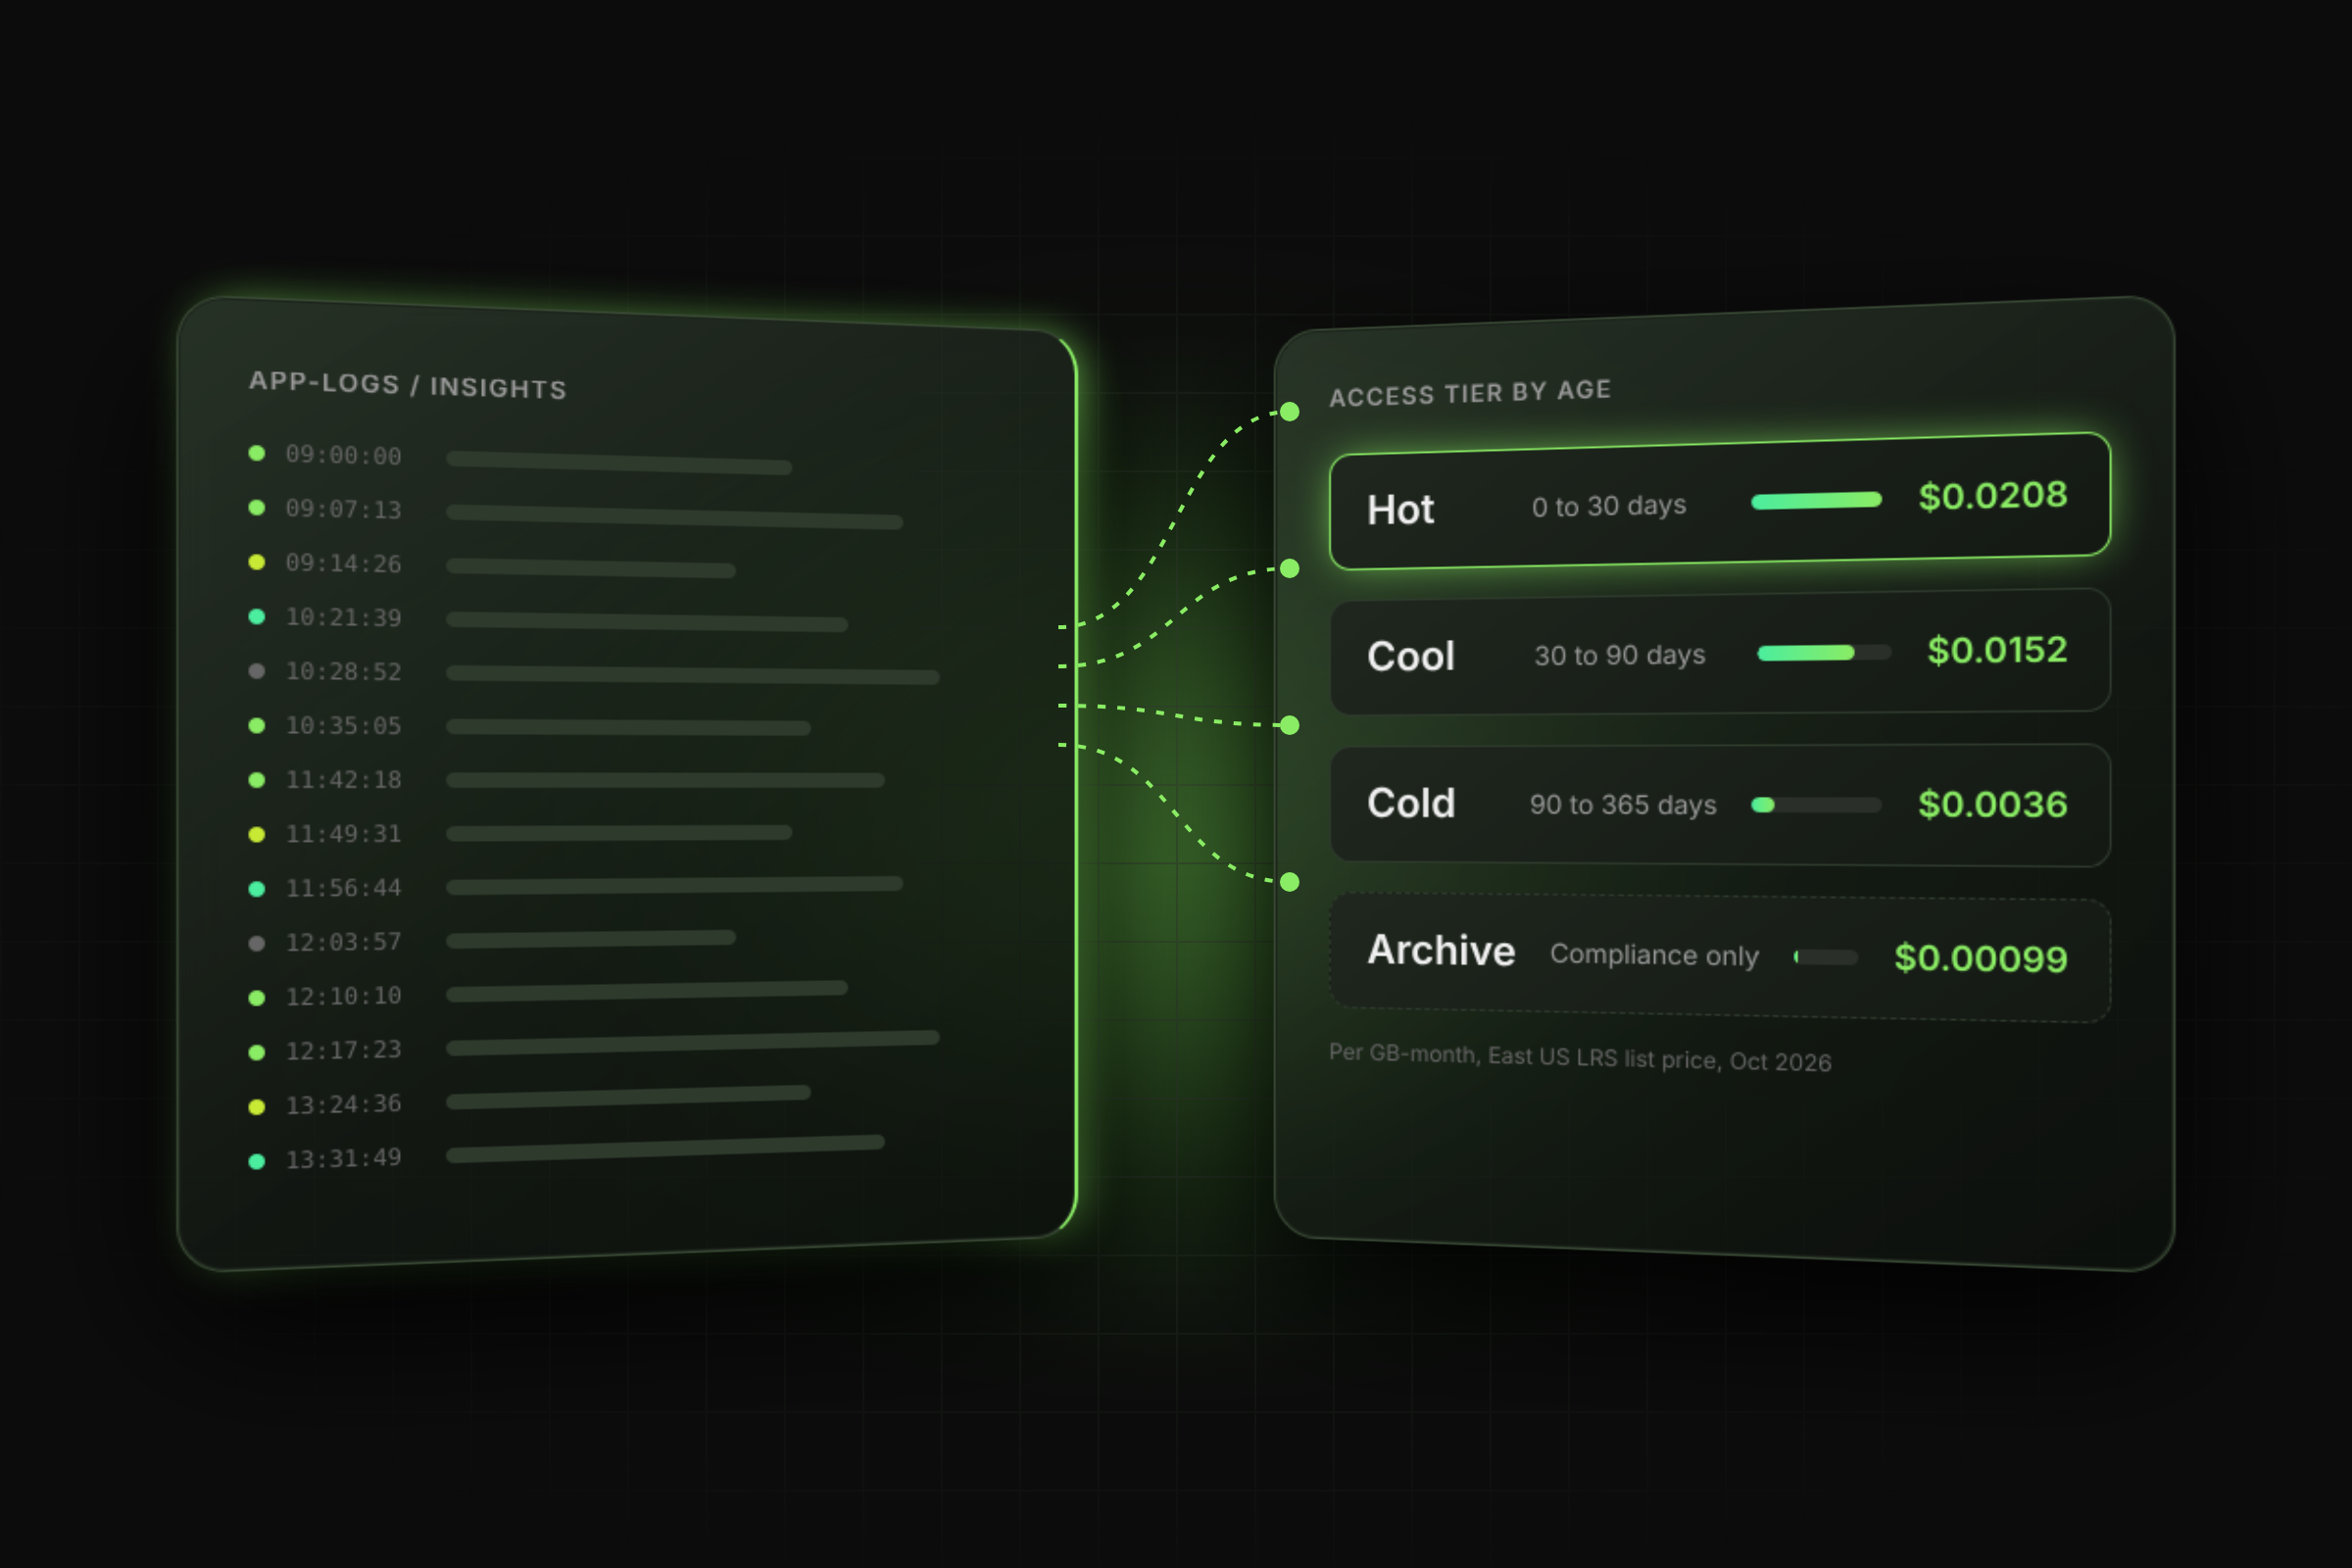
- Disk Tiering tracks your actual IOPS and throughput patterns to recommend and re-tier disks appropriately, (such as moving from Premium SSD to Standard SSD)
- Disk Cleanup identifies idle, unattached, unmounted, and no I/O disks -- three more types than Azure can show you natively -- and offers recommendations and the ability to clean up appropriate disks directly

Key capabilities for Azure:
- Autonomous rightsizing of Azure Managed Disks.
- Disk tiering recommendations and idle disk surfacing across subscriptions.
- No downtime; scoped permissions
- Azure Site Recovery (ASR) compatible.
- Terraform integration for environments managing Azure as code.
Azure customer results:
- A large information management firm ($6B+ revenue, Azure and GCP): $1.5M in annual savings, 46 percent storage cost reduction, 2x utilization improvement.
- An insurance technology company (Azure): $1.2M annual savings, 40 percent storage cost reduction, 45,000 tasks automated.
- A large national retailer (Azure): $230,000 annual savings, ~2x utilization improvement (49% to 82%), 28,000+ tasks automated for 350 TB.
- ESO Solutions, multinational software (Azure): 50 percent ROI, 70 percent utilization from a 30 percent baseline, zero downtime incidents post-deployment.
How it fits the stack: Lucidity is the storage and cost layer that complements Azure Monitor for infrastructure metrics and Dynatrace, Datadog, or AppDynamics for application performance. It is the only tool in this list that autonomously shrinks Azure Managed Disks.
2. Azure Monitor
Azure Monitor is Microsoft's native monitoring tool for the Azure cloud platform. It allows you to monitor the infrastructure, including databases, Azure Storage, Azure Kubernetes Service, and virtual machines. It will also assist you in optimizing your applications' availability and performance.
Azure Monitor offers a unified view of the health of your application and infrastructure with capabilities like log analytics, metrics, and alerts. Its integration with other Azure services, such as Azure Functions and Azure App Service, gives deeper insights and makes analysis easier. Azure Monitor is built on the Azure portal, eliminating the need to use any third-party monitoring tool.
3. Turbo360
Turbo360 (formerly Serverless360) is one of the best Azure monitoring tools for complex connections that have been developed on Azure. The platform contains capabilities including event triggers, alerts, diagnostics, end-to-end visibility, and unified Azure Monitoring.
Turbo360 also offers the advantage of auto-documenting your whole Azure infrastructure and providing total expense management. It supports the integration of popular notification platforms like Slack, PagerDuty, Microsoft Teams, etc.
It also provides a selection of monitors appropriate for architects, DevOps teams, and product managers and prompt failure detection. With Turbo360's threshold monitors, restoring operations without human involvement and using Autocorrect capabilities on resource state is easy.
4. Dynatrace
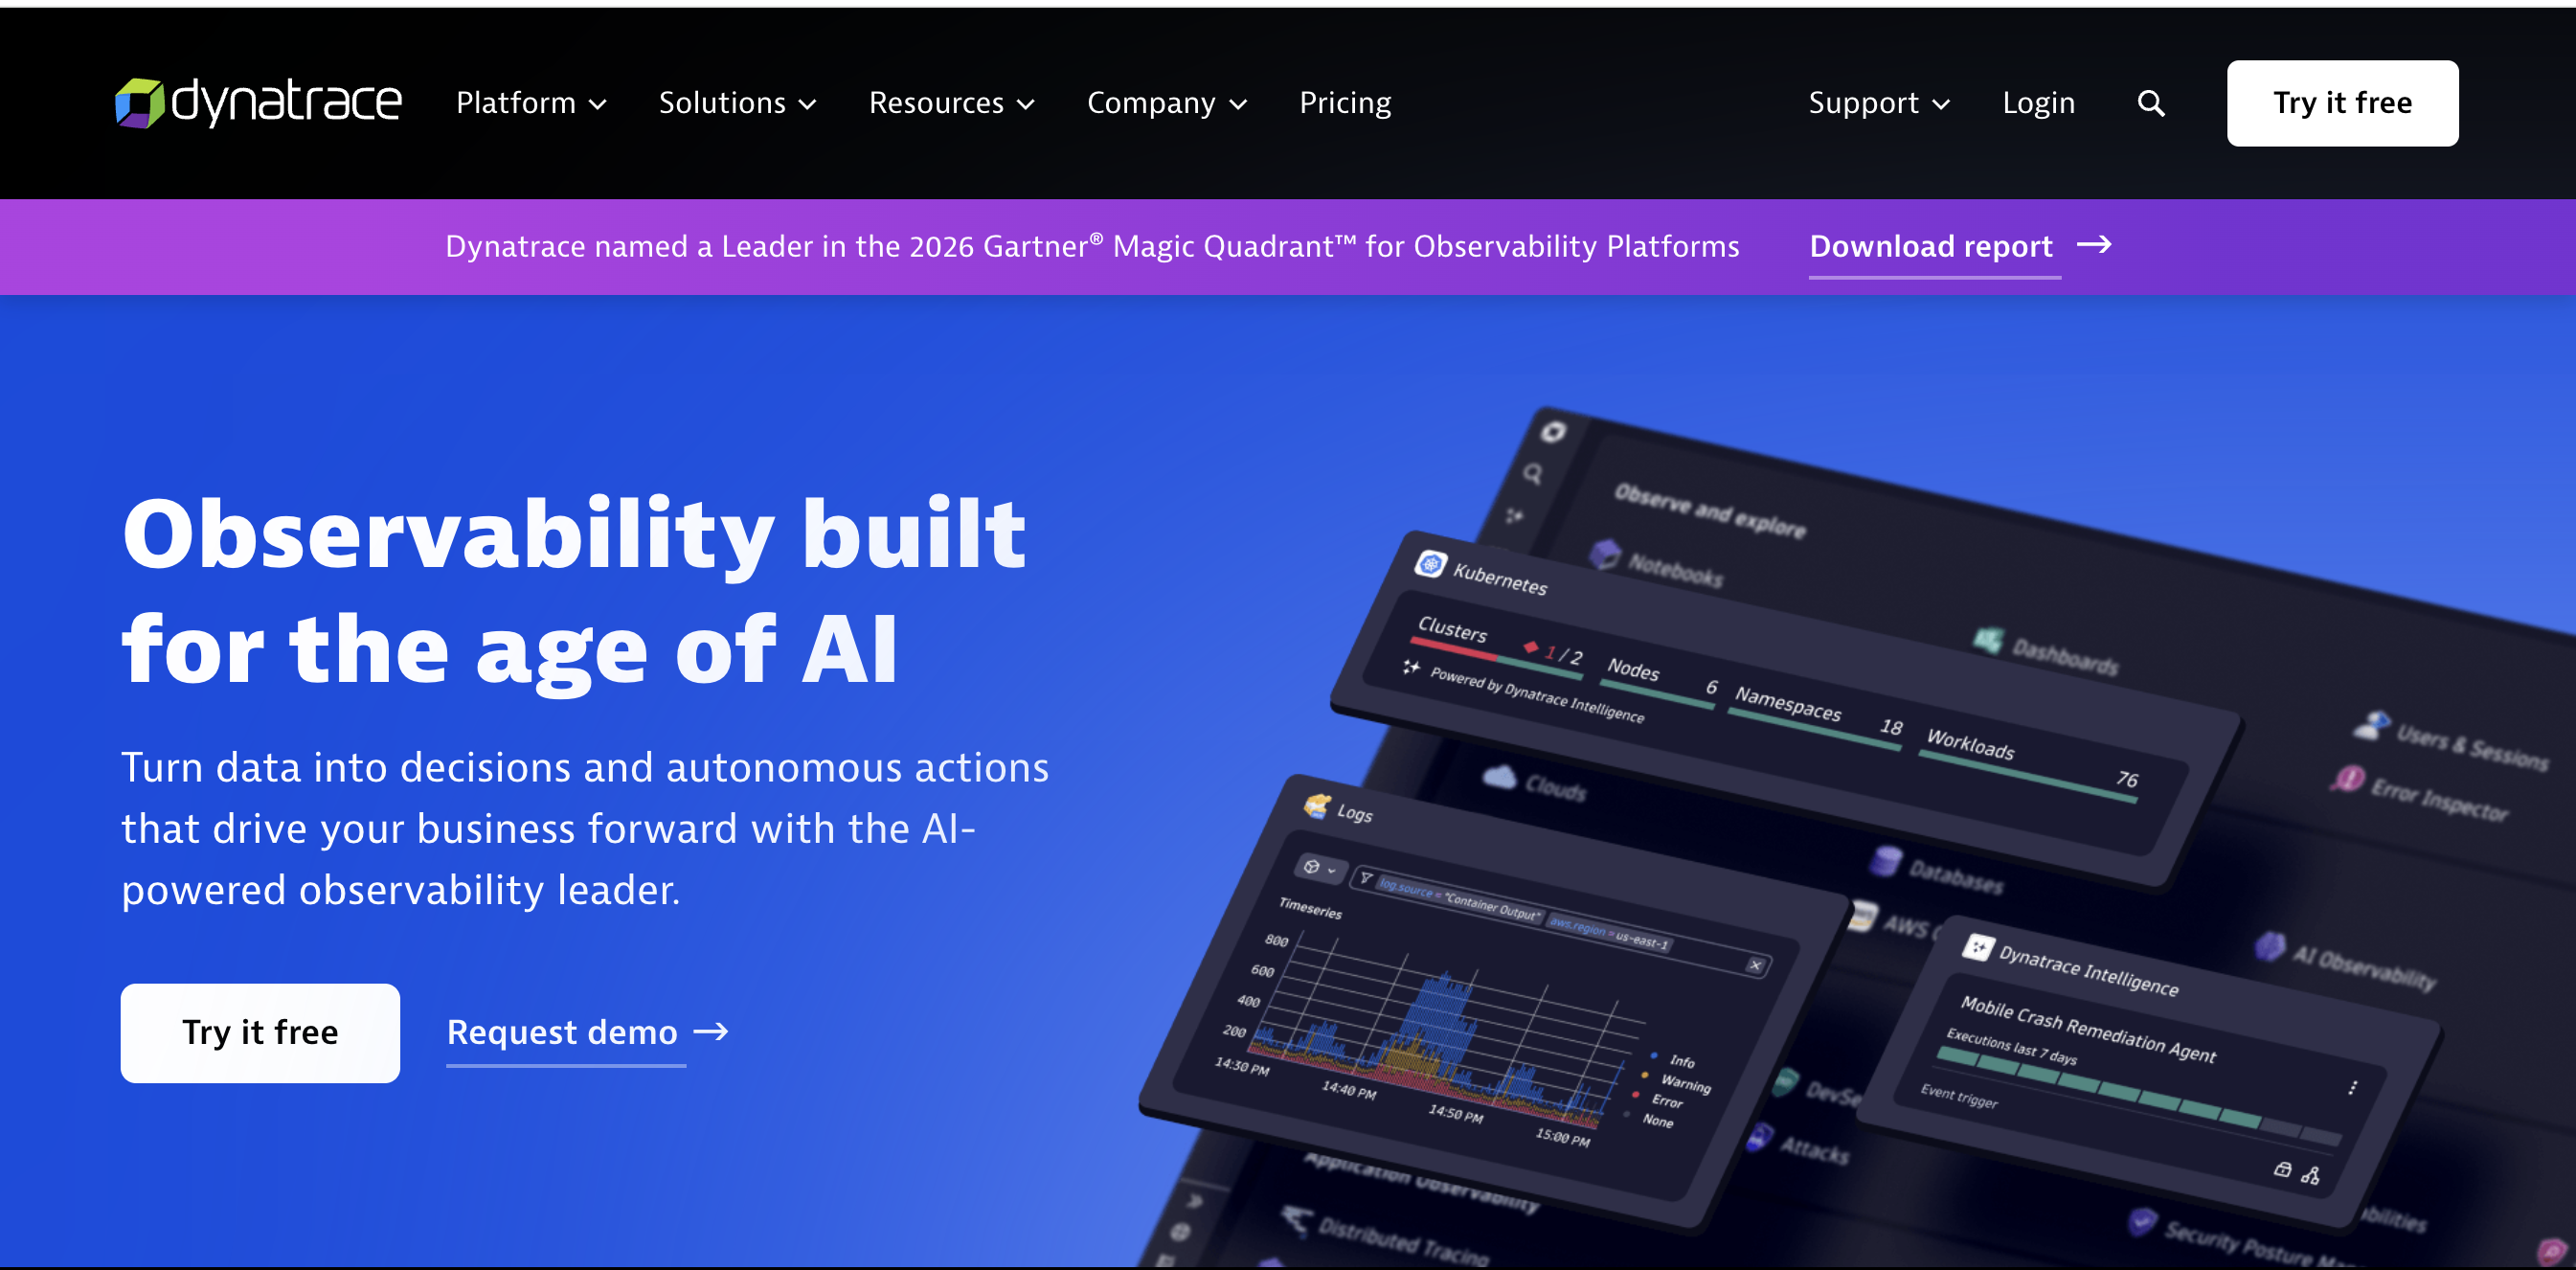
Dynatrace is an automated Azure monitoring solution that examines your Azure hybrid cloud setup using the most advanced Azure monitoring features. This infrastructure monitoring tool offers suggestions to improve the system's effectiveness.
You can see hosts, virtual machines, containers, networks, devices, logs, events, and orchestration at a scale using Dynatrace. It also offers root cause analysis and AI-assisted problem detection. Dynatrace's artificial intelligence capability continuously examines billions of dependencies to deliver an accurate root cause.
Using Dynatrace's automated deployment platform, you can get complete coverage for all applications and infrastructure in the Azure environment. The platform is a wholesome Azure monitoring solution with features like cross-team collaboration, AI support, continuous automation, sophisticated observability, user experience, and business analytics.
5. Datadog

Datadog is a cloud analytics and monitoring tool that provides real-time insights and monitoring for your whole stack. Because it provides customized dashboards and alarms, it's a great tool for teams monitoring their infrastructure and apps.
The platform continuously monitors, analyzes, and reports any issues in a dynamic environment before they substantially impact the user experience. Its capabilities are designed to expand at the speed of your Azure environment.
Datadog provides APM, log management, network monitoring, serverless computing, real-user monitoring, and many other capabilities. It also supports real-user monitoring and sophisticated root-cause analysis.
6. New Relic
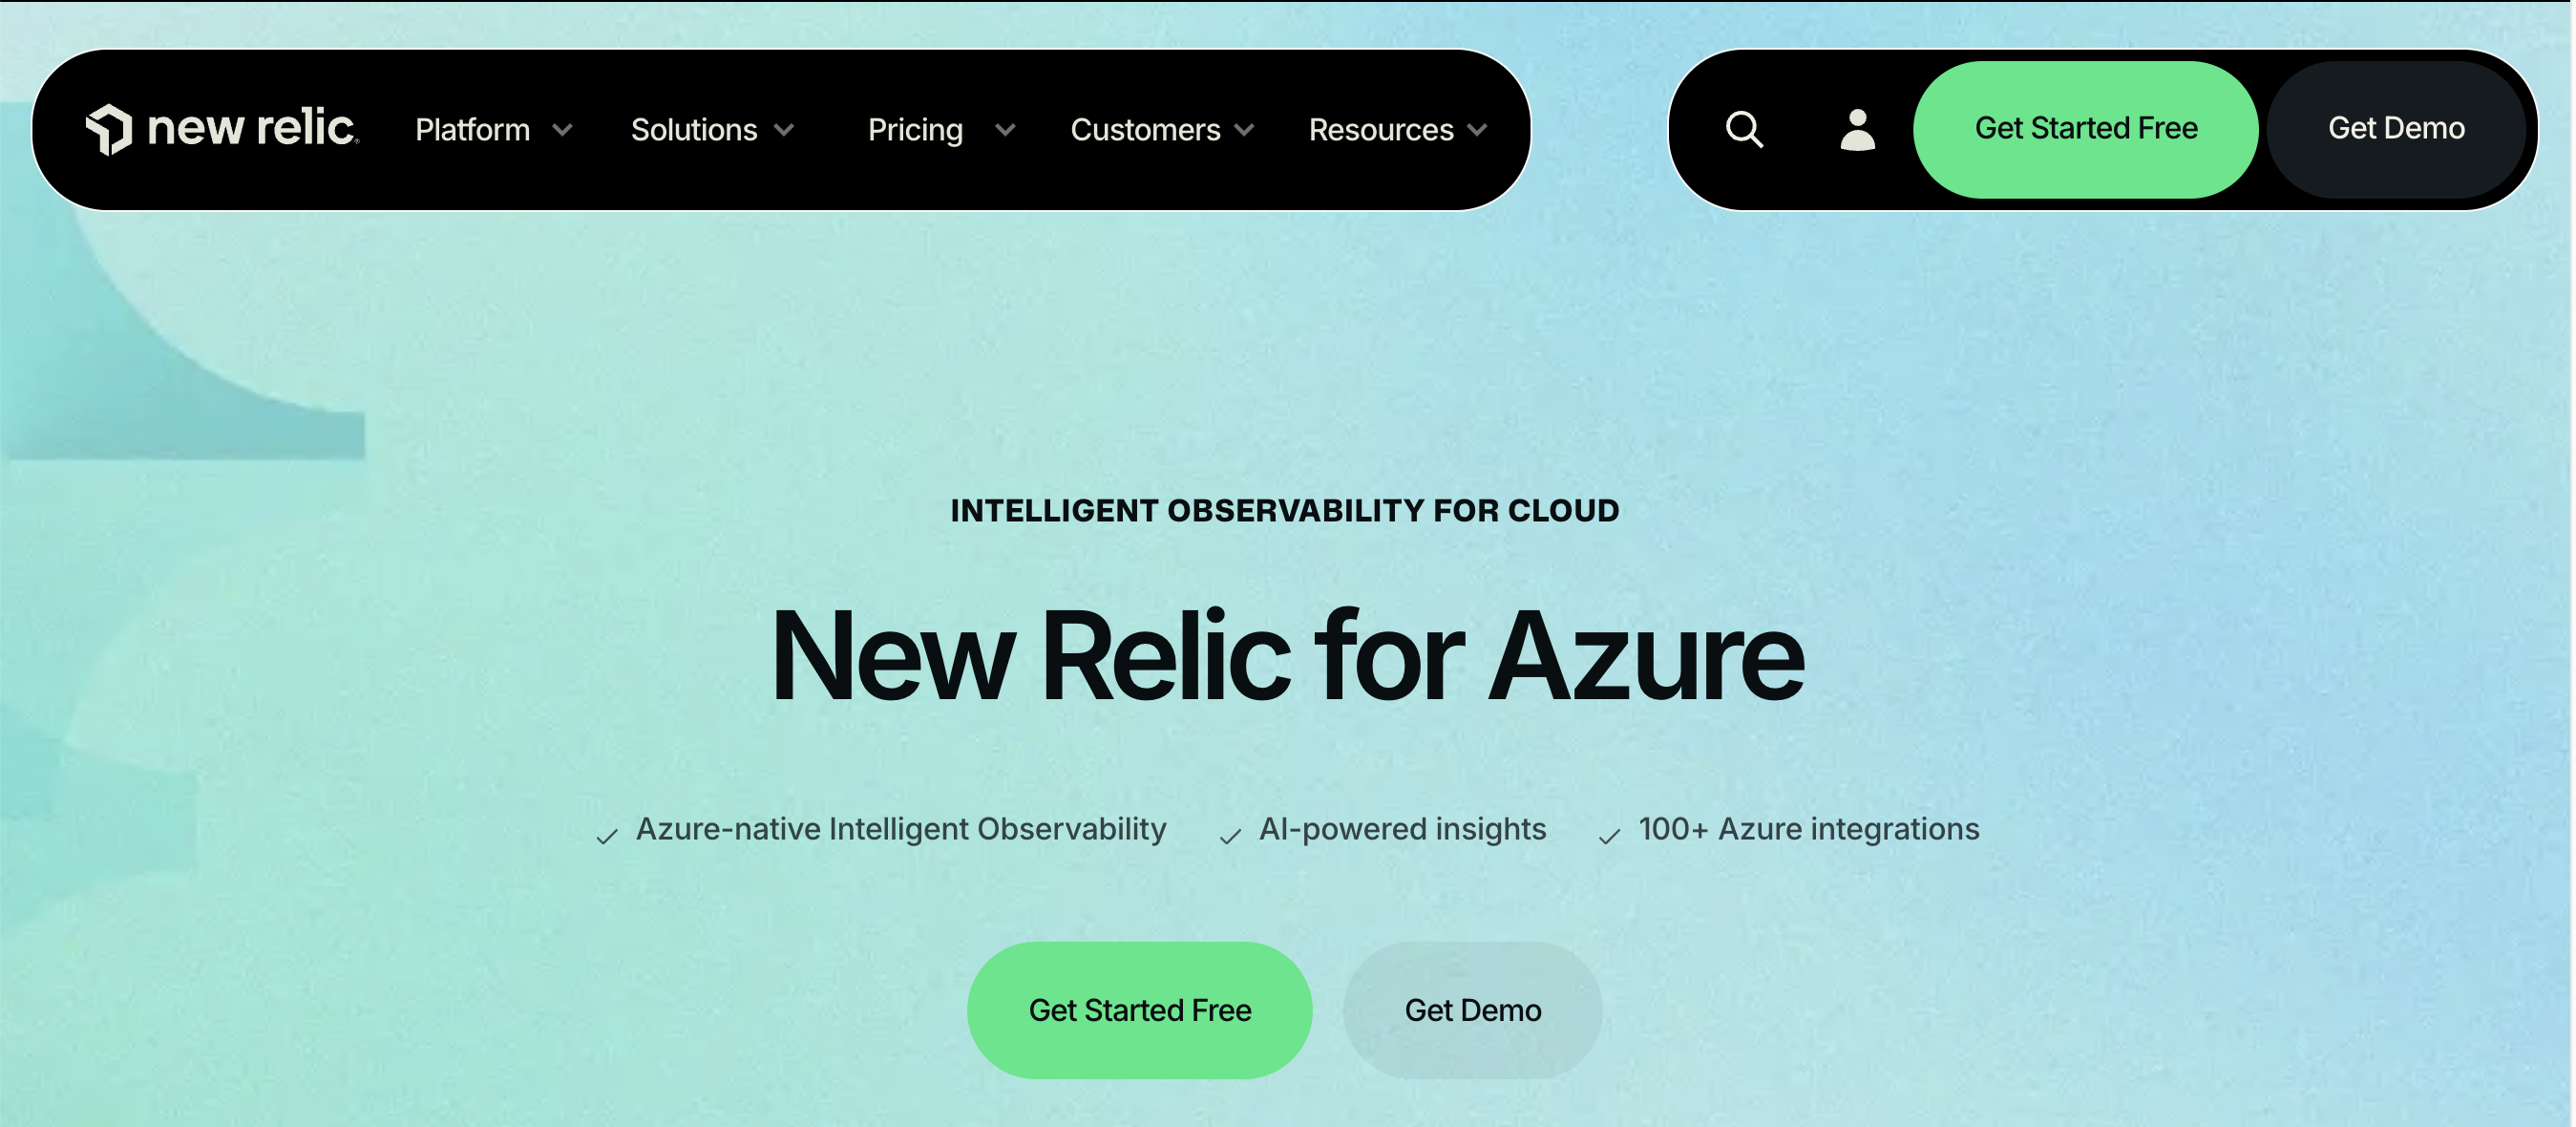
New Relic is a cloud monitoring and management solution that provides information about the health and performance of your infrastructure and applications. It provides access to real-time data, allowing you to quickly create reports and identify important problems.
It enables you to comprehend bottlenecks, dependencies, and application performance quickly. It can include details on sluggish transactions, error rates, page load times, and a list of servers hosting the application.
Customers' data is stored in a secure Tier III, SSAE-16-certified data center. With Full-Stack Observability, you can troubleshoot, debug, and optimize performance throughout your entire stack.
7. Solarwinds
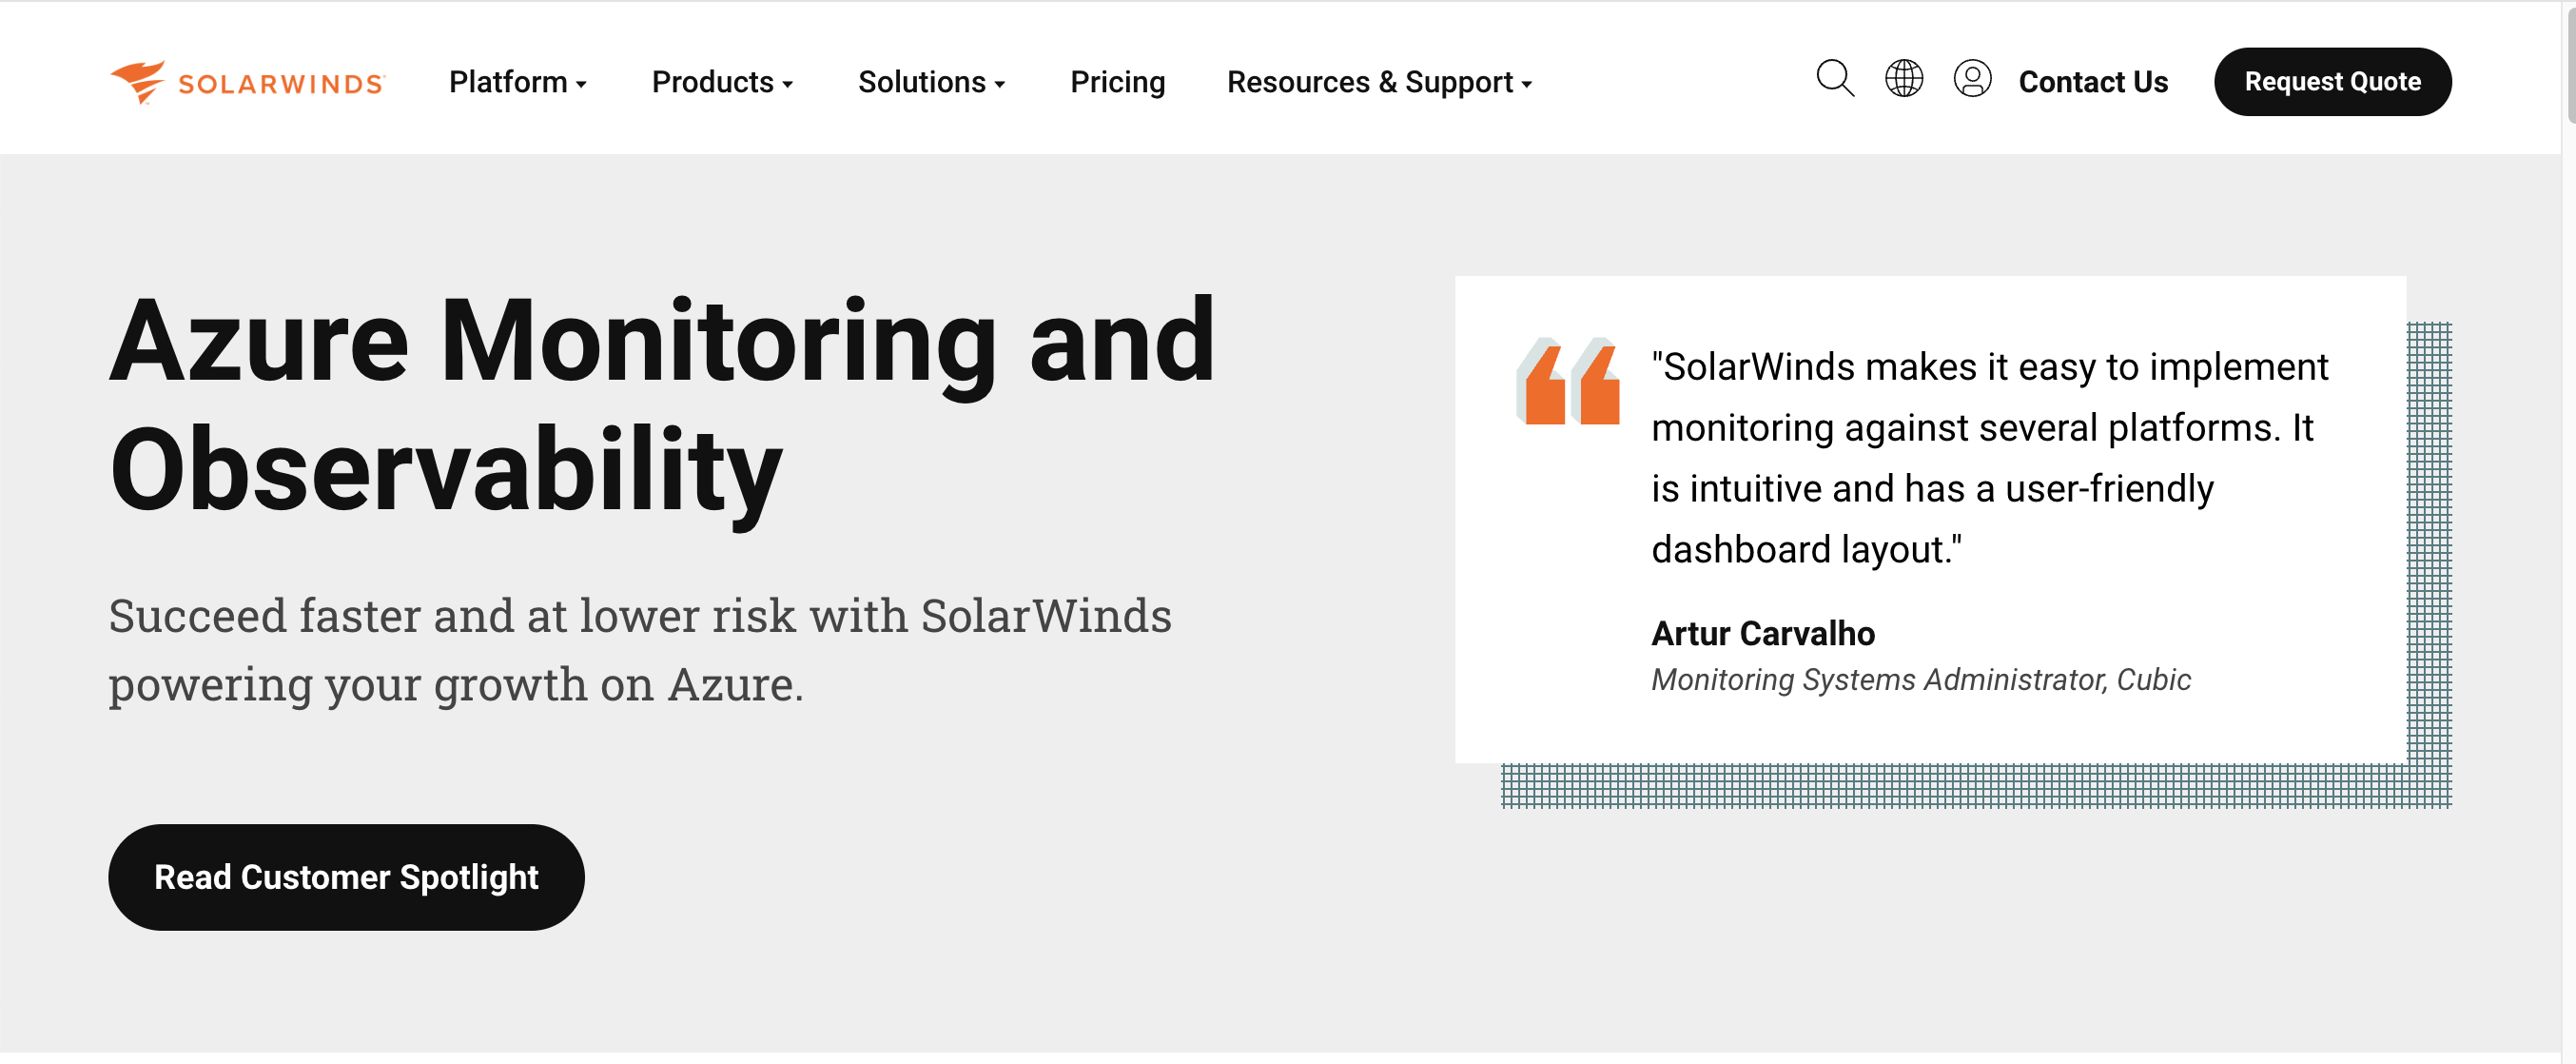
Solarwinds Server Application Monitor is another considerable Azure monitoring tool that can simplify and ease server and application monitoring. You can use this monitoring tool to see how different applications depend on one another.
It is equipped with every feature required to monitor the vast array of services and Azure resources, in addition to other infrastructure, to obtain a comprehensive view of your system's state. Furthermore, it can incorporate Azure monitoring into the management of Linux or Windows servers, on-site servers, and the apps they host.
With the help of this platform, you can improve the performance of your application in many ways, such as transaction tracking, exception tracking, live code profiling, and root cause analysis.
8. Paessler
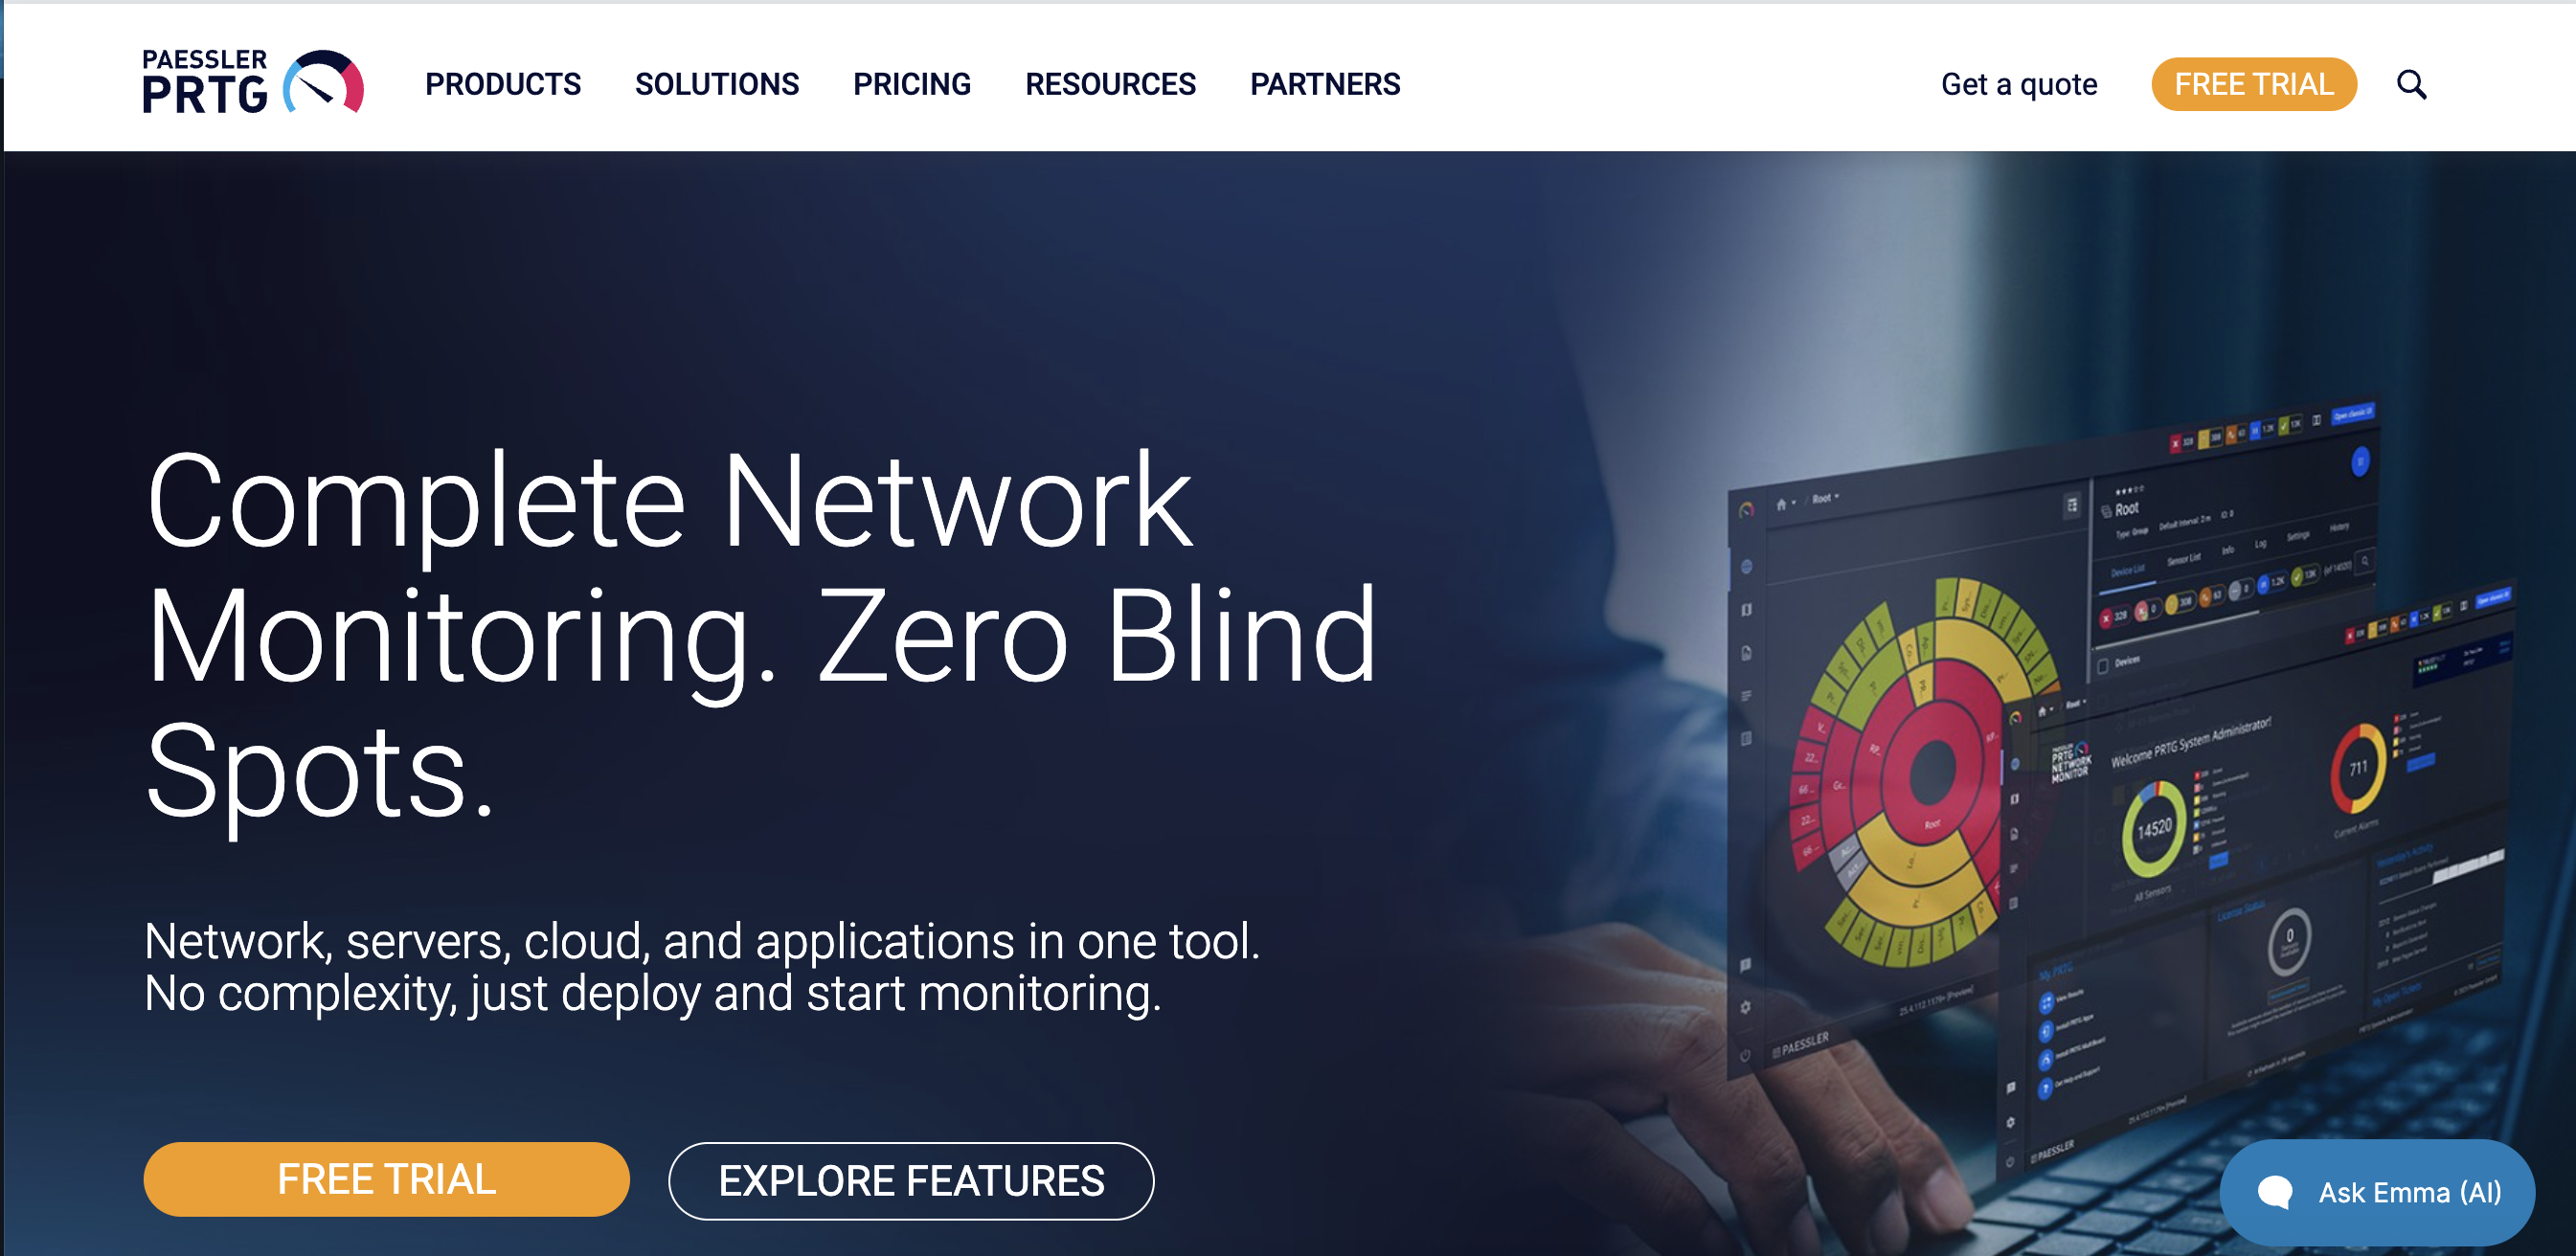
Another viable option is the Paessler Azure monitoring service, which includes performance thresholds and warnings to automate monitoring. You can also monitor additional networks, web services, and application-related resources.
The Paessler PRTG is a collection of resource monitors. Every customer receives the entire package; however, they can personalize the setup by selecting which monitors to enable. The amount of monitoring credits you purchase determines the cost of the service.
This platform seeks to serve as your one-stop shop for Azure monitoring needs. One such service is the Microsoft Azure Virtual Machine sensor, which monitors every Azure virtual machine (VM) in your Microsoft Azure account and provides information on CPU utilization, including both spent and unused CPU credits. With its mobile solutions, PRTG's cloud monitoring for Microsoft Azure can easily be done while on the go.
9. Splunk (FKA AppDynamics)
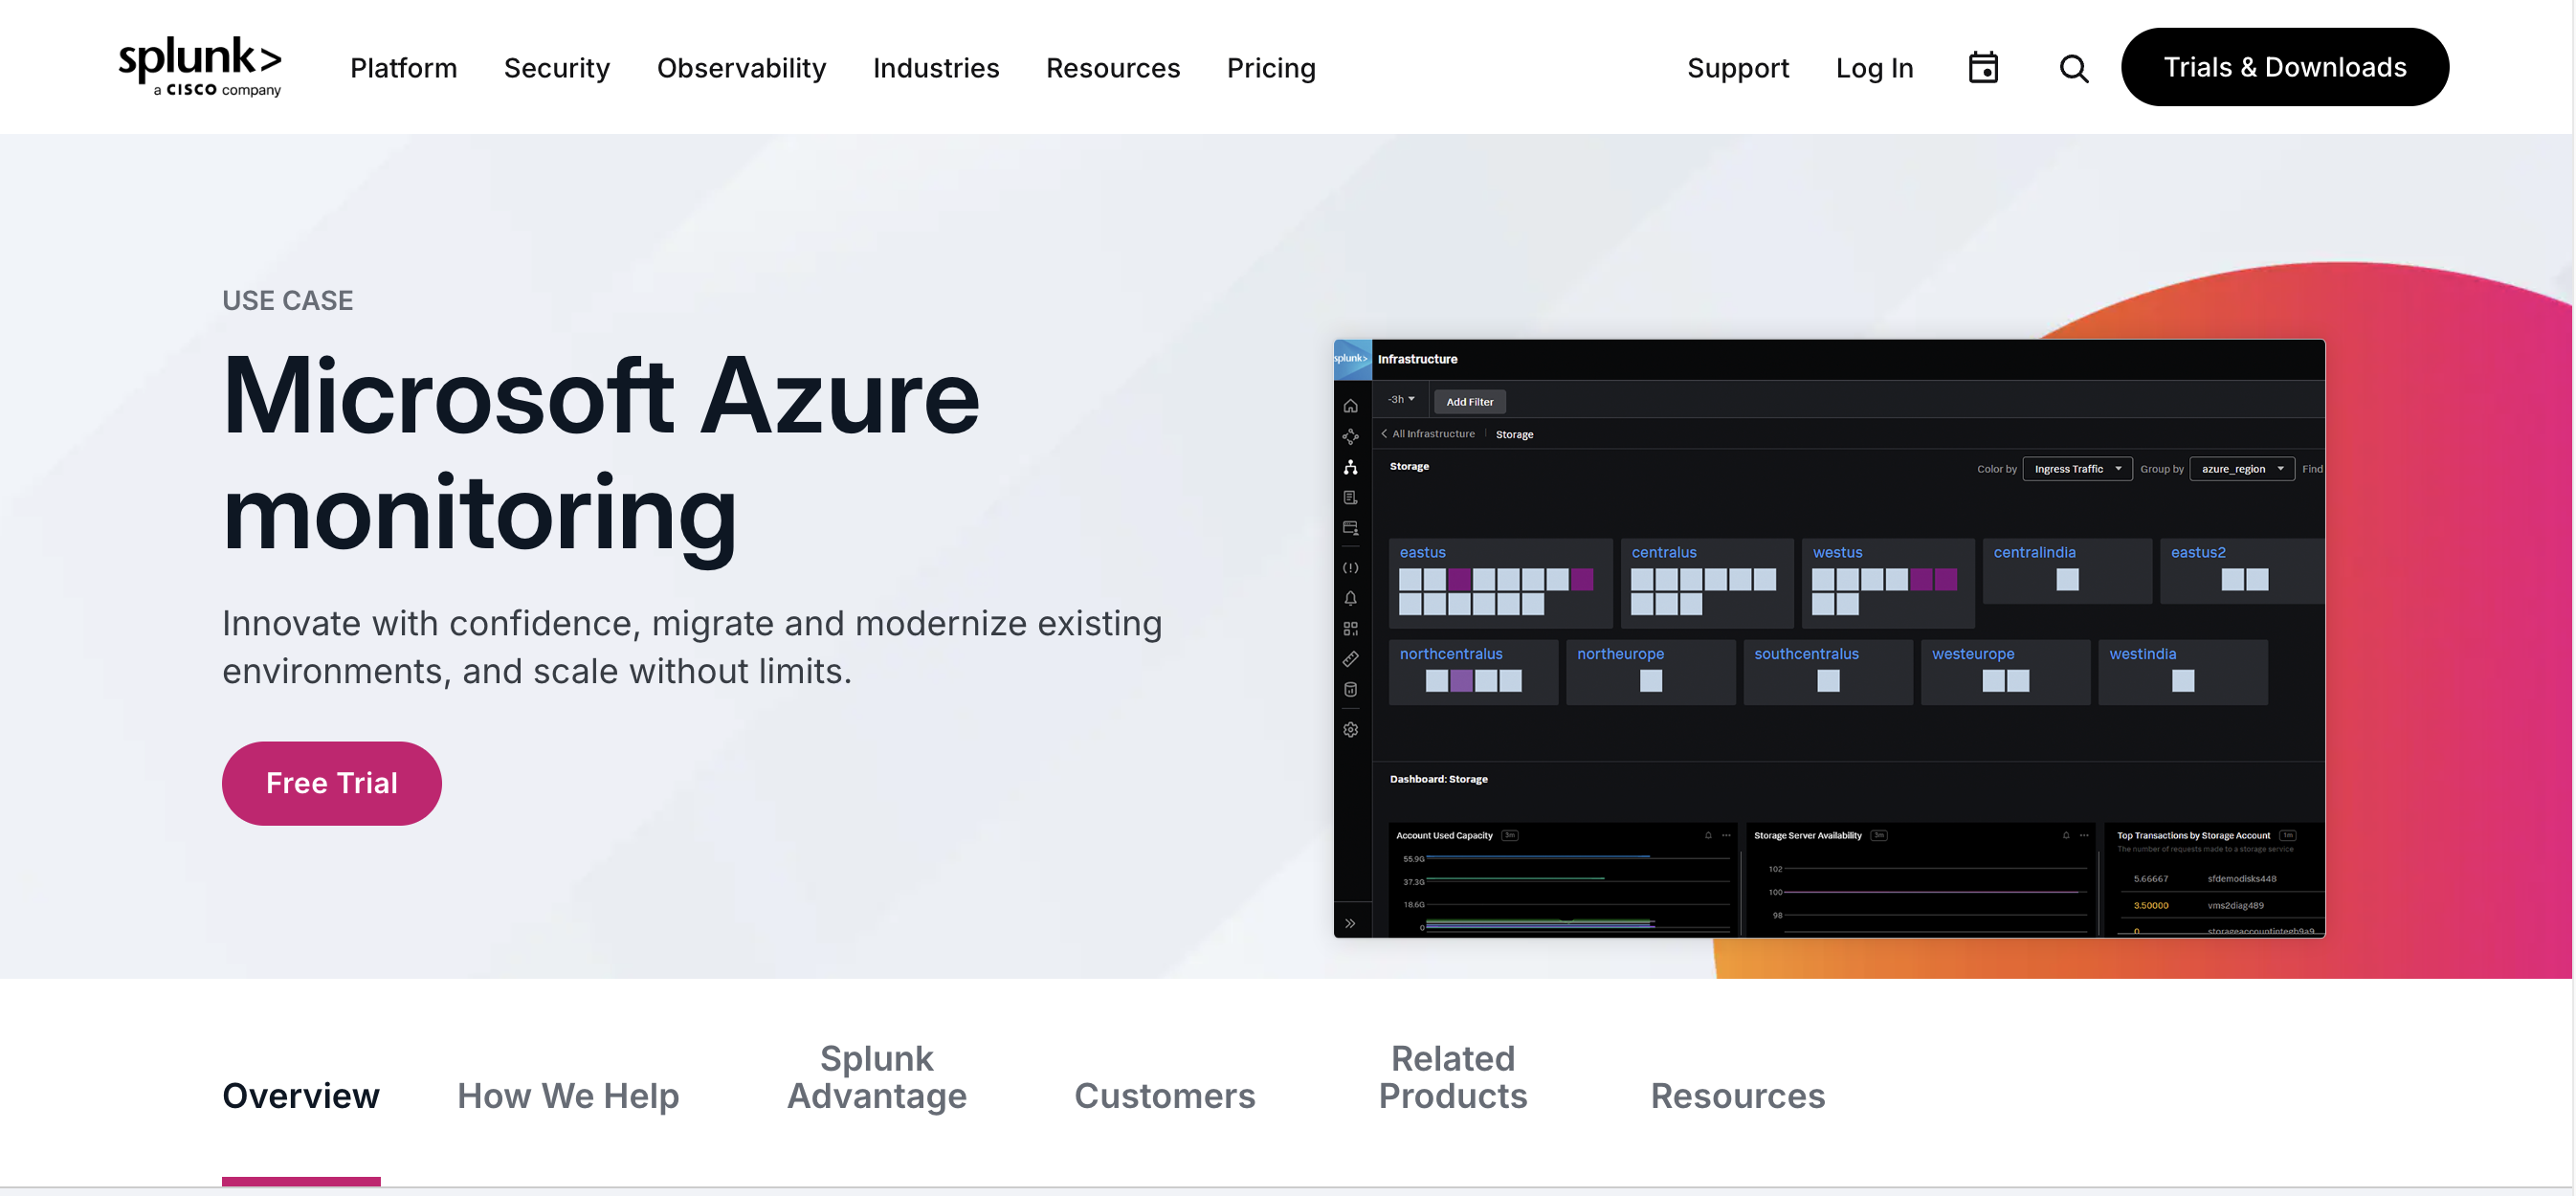
With another viable Azure monitoring solution, AppDynamics absorption into Splunk, you can quickly diagnose performance problems and ensure the best possible performance of your applications across entire on-premise infrastructures.
Splunk provides business analytics and enterprise-grade application performance monitoring. This serverless monitoring tool for Azure Functions allows you to monitor the performance of applications running as functions on Microsoft Azure. The AppDynamics .NET Agent supports Azure Functions operating on App Service plans.
After you install the agent, it will automatically find your business transactions in Azure Functions. This implies you can link functions with end-user monitoring, generate callgraphs, and obtain snapshots.
10. Site24&7

Site24x7 provides an agile, comprehensive monitoring tool supporting over 100 Azure cloud services. It finds bottlenecks in advance by obtaining real-time information on your Azure resources, including virtual machines, storage accounts, and databases. Guaranteeing ideal resource usage and offering total access to your Azure infrastructure results in enhanced productivity.
This Azure monitoring tool from Site24x7 helps find the precise source of problems, spot deviations, and fix performance problems. With the tool's assistance, you can scale your Azure services up or down to their optimal capacity. Compared to Azure's built-in monitoring tool, it is more affordable and supports more features.
Maximize Your Azure Cloud’s Performance With the Best Monitoring Tool
Choosing the right Azure Monitoring Tool is essential for maintaining the performance and availability of your Azure resources. With the top 10 Azure monitoring tools mentioned above, you can enhance your monitoring capabilities, proactively identify and address issues, and optimize the performance of your Azure environment effectively.
Ultimately, choose the tool that best meets your monitoring needs, scalability, ease of use, integration, and cost requirements. Then, you can maximize the value of your Azure investments and optimize your cloud environment.
Frequently Asked Questions
Q1. What is the best Azure monitoring tool in 2026?
There is no single best tool. The strongest Azure operations stacks combine Azure Monitor for native metrics, a third-party APM such as Dynatrace or Datadog for application performance, and Lucidity for cost and block storage visibility. Each layer answers a different question.
Q2. Does Azure Monitor cover block storage cost optimization?
No. Azure Monitor surfaces performance metrics and basic utilization data, but it cannot autonomously rightsize Managed Disks. Azure Advisor produces recommendations that require manual execution. Lucidity Disk Scaling closes that gap by acting on the findings continuously, without downtime.
Q3. How much does Azure block storage waste cost the average enterprise?
Enterprise teams use only about 30 percent of the Azure Managed Disk capacity they provision. The gap exists because the cost of running out (downtime) is much higher than the cost of overprovisioning. Lucidity Assessment quantifies the exact waste in your environment in 15 minutes, agentless.
Q4. Can Lucidity replace Azure Monitor?
No. Lucidity does not replace infrastructure or application monitoring; it focuses on block storage cost optimization. Most Azure environments run Azure Monitor for native telemetry, an APM tool for application performance, and Lucidity for cost and storage rightsizing.
Q5. What are the different modules Lucidity offers?
Lucidity Disk Scaling autonomously rightsizes overprovisioned block storage volumes across AWS, Azure, and GCP. Lucidity Disk Tiering re-tiers disks based on your actual IOPS and throughput data. Disk Cleanup surfaces idle, unattached, unmounted, no I/O disks across subscriptions. Many Azure customers run it all for compounding savings.
Q6. What permissions does Lucidity require in an Azure subscription?
The Lucidity Assessment is fully agentless and read-only. AutoScaler uses scoped permissions limited to the specific overprovisioned volumes it acts on, with pen test reports and security documentation available for InfoSec review. Most security teams approve after the read-only Assessment.
Q7. How fast does Lucidity deliver savings on Azure?
The Lucidity Assessment produces a savings projection in 15 minutes. Production POCs typically begin within two weeks and show measurable savings within 30 to 60 days. A global chemicals manufacturer saw $50,000 in savings in the first 60 days and 2.5x ROI in the same window.
Q8. Are Azure monitoring tools compatible with Azure Site Recovery?
Most mature tools, including Lucidity, are ASR compatible. Confirm during vendor evaluation if ASR is part of your DR strategy. Lucidity AutoScaler operates alongside ASR without interfering with replication, which is a common architectural question during InfoSec review.
Table of Contents
Sign Up