Introduction
Cloud promises elastic infrastructure that scales with demand. The reality for most DevOps, ITOps, and FinOps teams is messier: either you over-provision and pay for idle capacity, or you under-provision and face degraded performance the moment traffic spikes.
Azure autoscaling closes that gap, but only when configured correctly. A misconfigured autoscale profile — thresholds too close together, no scale-in rule, or an uncapped maximum instance count — creates its own set of problems.
The result: runaway costs, flapping instances (repeated rapid scale-up/scale-down cycles), or performance failures that the autoscaler technically "fixed" by adding compute while the real bottleneck remained elsewhere.
This guide covers:
- Foundational concepts behind Azure autoscaling
- Step-by-step configuration for both VMSS and App Service
- The failure modes teams encounter most often
- Best practices that separate a reliable setup from one that requires constant firefighting
Key Takeaways
- Azure autoscaling dynamically adds or removes resource instances based on demand signals evaluated by Azure Monitor
- The two primary resources are Virtual Machine Scale Sets (VMSS) and Azure App Service; each has a distinct configuration path
- Scaling is horizontal (adding/removing instances), not vertical — resizing a single VM typically requires a reboot
- Top failure modes: threshold flapping, wrong scaling metric, and persistent disk costs on deallocated VM disks after scale-in
- Works well for straightforward workloads — but reliable autoscaling requires deliberate threshold design, load testing, and ongoing monitoring
What Is Azure Autoscaling and How Does It Work?
Azure Monitor autoscale lets your infrastructure respond to actual demand — adding or removing resources automatically instead of locking in static capacity for peak load. Rather than over-provisioning and paying for idle headroom, autoscaling adjusts the number of running instances so capacity tracks real usage.
Horizontal vs. Vertical Scaling
These two approaches work very differently in Azure — and only one supports real-time autoscaling:
- Horizontal scaling (scale-out/in): Adds or removes identical VM instances. Zero downtime, handled dynamically by Azure Monitor autoscale.
- Vertical scaling (scale-up/down): Resizes a single VM's CPU or RAM. Typically requires a reboot and is not supported as a real-time autoscaling mechanism.
Azure Monitor autoscaling operates horizontally. Vertical scaling is a separate, manual (or scripted) operation.
How Azure Monitor Evaluates Rules
Azure Monitor autoscale evaluates profiles and rules every 30–60 seconds depending on resource type. When a metric breaches a threshold defined in an autoscale profile, the autoscale engine provisions or deallocates instances. The autoscale settings themselves are Azure Resource Manager resources, meaning they can be versioned and deployed like any other ARM artifact.
That evaluation logic is driven by one of four trigger types — each suited to different workload patterns.
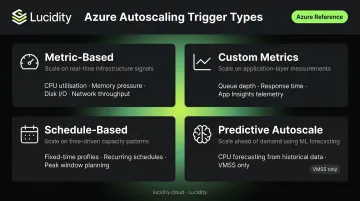
Four Types of Autoscaling Triggers
| Trigger Type | Description |
|---|---|
| Metric-based | CPU %, memory, disk I/O, network — evaluated against thresholds |
| Custom metrics | Queue depth, response time, App Insights signals — application-level |
| Schedule-based | Fixed-time or recurring profiles for predictable patterns |
| Predictive autoscale | ML-based CPU forecasting from historical data (VMSS only, requires 7+ days of history) |
Which Azure Services Support Native Autoscaling
- Virtual Machine Scale Sets (VMSS) — most configurable, supports all four trigger types
- Azure App Service — metric and schedule-based rules at the plan level
- Azure Cloud Services — role-level autoscaling
- Service Fabric — managed cluster secondary node types via VMSS-backed autoscale settings
- Azure Functions — automatic scaling on Consumption and Premium plans; no rule configuration required. Dedicated plan requires explicit autoscale rules.
Before You Configure: Prerequisites and Key Decisions
What Must Be in Place
Before touching an autoscale profile, confirm:
- A deployed VMSS or App Service Plan exists
- Azure Monitor access with appropriate IAM permissions is configured
- The workload pattern is understood — predictable schedule vs. unpredictable spikes determines whether you need metric-based rules, schedule-based profiles, or both
One more prerequisite: don't enable autoscaling before establishing a performance baseline. Observe CPU, memory, and request patterns for at least a few days. An autoscaler calibrated without baseline data will have thresholds set to guesswork.
Three Instance Count Decisions You Must Make
| Setting | What It Controls | Common Mistake |
|---|---|---|
| Minimum | Floor that prevents total outage | Setting too low exposes the app to degradation |
| Maximum | Ceiling that caps cost exposure | Leaving this uncapped — generates unexpected bills |
| Default | Fallback if metrics become unavailable | Often left unreviewed |
Microsoft's Architecture Center explicitly recommends limiting maximum instances to control costs. An uncapped maximum is one of the fastest ways to generate an unexpected Azure bill.
What Should Not Proceed to Configuration
- Applications not designed for horizontal scale — stateful apps without proper session management may not behave correctly with multiple instances
How to Configure Azure Autoscaling: Step-by-Step
Autoscaling configuration follows a defined sequence. Skipping steps (particularly forgetting to define a scale-in rule alongside scale-out, or leaving instance limits undefined) leads to either runaway costs or insufficient scale-down behavior.
Configuring Autoscaling for Virtual Machine Scale Sets (VMSS)
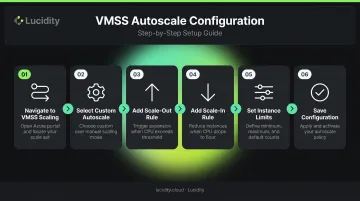
Portal walkthrough:
- Navigate to the VMSS resource → Scaling
- Select Custom Autoscale
- Add a scale-out rule: for example, add 1 instance when average CPU exceeds 75% over a 10-minute window
- Add a scale-in rule: remove 1 instance when CPU falls below 30% over a 10-minute window
- Set instance limits: minimum, maximum, default
- Save
Azure CLI and ARM/Bicep templates (Microsoft.Insights/autoscalesettings) provide identical control with better scripting support for multi-environment deployments.
Cooldown period: The VMSS portal example uses a 5-minute cooldown, which is the delay Azure waits after a scaling action before re-evaluating rules. This prevents rapid consecutive scaling events. Start at 5 minutes and adjust based on observed behavior; workloads with slow initialization times may need longer cooldowns.
Metric source options for VMSS:
- Host metrics require no agent and cover Percentage CPU, Network In/Out, Disk Read/Write Bytes, and Disk Read/Write Operations/Sec
- Azure Diagnostics Extension requires an agent but exposes more granular guest OS metrics like PercentIdleTime
- Application Insights requires SDK instrumentation and surfaces request rate, response time, and other application-level signals
The right choice depends on whether infrastructure-level or application-level signals are a better indicator of actual user demand.
Configuring Autoscaling for Azure App Service
Portal walkthrough:
- Navigate to the App Service Plan → Scale out (App Service plan)
- Choose Custom autoscale
- Add scale-out and scale-in rules using metrics such as CPU Percentage or HTTP Queue Length
- Configure cooldown periods and instance limits
One important operational detail: autoscale settings apply to all apps within the same App Service Plan. If you have multiple apps sharing a plan, they all scale together. Consider plan-level isolation before enabling autoscaling if your apps have meaningfully different traffic profiles.
Scheduled autoscaling as a complement to metric-based rules: For predictable patterns — say, scale out at 7:30 AM Monday–Friday, scale in at 8:00 PM — scheduled profiles pre-provision capacity before demand arrives. This eliminates the cold-start latency that metric-based rules introduce, since reactive rules only fire after a threshold is already breached. Use both together: schedules for known peaks, metrics for unpredictable spikes.
Validating the Configuration
With both VMSS and App Service configurations in place, the next step is confirming they actually behave as expected. Before relying on autoscaling in production:
- Enable diagnostic logging — route Autoscale Evaluations and Autoscale Scale Actions resource logs to Log Analytics via diagnostic settings
- Simulate load — use Azure Load Testing to trigger a deliberate scale-out event
- Verify instance provisioning — confirm instances are added within the expected window and the load balancer distributes traffic correctly
- Confirm scale-in fires — wait through the cooldown period after load drops and verify instances are removed
- Check activity logs — scale events appear in the Azure activity log with timestamps and rule details
Common Azure Autoscaling Problems and How to Fix Them
Threshold Flapping
The autoscaler continuously adds and removes instances in rapid succession. This usually means scale-out and scale-in thresholds are set too close together — scale out at 70% CPU and scale in at 65%, and normal metric fluctuations will constantly cross both boundaries.
To fix it:
- Create a meaningful gap between thresholds — scale out above 75%, scale in below 30%
- Increase the cooldown period to let the system stabilize between actions
- Use a longer aggregation window (10-minute averages rather than 1-minute snapshots) — Microsoft's best practices documentation uses 10-minute windows in its guidance examples
Autoscaling Triggers But Performance Doesn't Improve
New instances provision, but application response times stay degraded. The scaling metric usually isn't the actual bottleneck — CPU might look fine while the application is hitting database connection limits, memory pressure, or I/O saturation. Long startup times can also mean instances aren't ready before users experience failures.
To fix it:
- Audit actual consumption across CPU, memory, disk I/O, and network
- Switch to a metric that reflects real demand: queue depth for queue-based workloads, or HTTP queue length and App Insights response latency for user-facing apps
- For startup latency, use pre-warmed instances (App Service automatic scaling supports always-ready and prewarmed instances) or schedule-based profiles to have capacity ready before demand peaks
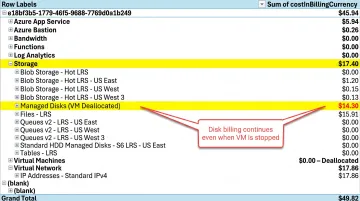
Hidden Storage Costs After Scale-In
Compute spend drops after scale-in, but Azure storage costs remain elevated. When Azure VMs are deallocated, compute billing stops, but Premium SSD managed disks continue to accrue charges at full provisioned price, regardless of whether the VM is running. Standard SSD and Standard HDD disks also incur ongoing charges based on provisioned size and transactions. Most teams assume "stopped VM = stopped billing" — for managed disks, that assumption is wrong.
To fix it:
- Implement a disk tier management strategy for deallocated VMs — downgrade attached disks from Premium SSD to Standard HDD or Standard SSD when VMs are not running
- Audit for unattached disks regularly; Microsoft provides guidance for identifying and deleting unattached managed disks to eliminate unnecessary spend
- For teams managing this at scale, Lucidity's Lumen monitors IOPS, throughput, latency, and cost across your Azure disk estate, identifying idle, zero-I/O, and mistiered disks and enabling tier changes (for example, Premium SSD to Standard SSD) without infrastructure changes or a maintenance window
Best Practices for Azure Autoscaling
Always define both scale-out and scale-in rules. Microsoft's Architecture Center is direct on this: if you configure scale-out without a corresponding scale-in rule, the app may scale out and never scale back in, holding capacity at maximum indefinitely. Pair every scale-out rule with an explicit scale-in counterpart.
Match the metric to the workload:
- CPU percentage works for compute-bound workloads
- HTTP Queue Length is better for web apps under request load
- Application Insights metrics (response time, request rate) give the most accurate signal for user-facing applications where the bottleneck is application behavior, not raw compute
- Queue depth works well for message-processing workloads
Understand scale-out vs. scale-in rule logic. Azure fires scale-out if any scale-out rule condition is met. Scale-in only fires if all scale-in rule conditions are met simultaneously. This asymmetry matters when designing multi-rule profiles — overly specific scale-in conditions can prevent scale-in from ever firing.
Monitor the autoscaling engine itself. Autoscaling depends on Azure Monitor metric pipelines. If a resource is misconfigured or the metric agent fails, scaling silently stops working. Set up alerts for:
- Instance count holding at minimum or maximum for longer than expected
- No autoscale evaluation events within an expected window
- Scale action failures in the Autoscale Scale Actions resource log
Address the full cost picture — not just compute. Once scale-in is firing correctly, verify that storage costs are actually decreasing. Disk charges on deallocated VMs are one of the most consistently overlooked cost leaks in autoscaling setups.
Native cloud dashboards rarely flag these. Lucidity's Assessment can scan your Azure environment in minutes, requiring no agents or infrastructure changes, and identify idle, mistiered, and zero-I/O disks that are quietly draining budget.
Conclusion
Azure autoscaling demands ongoing attention. The initial setup — baseline, thresholds, scale-in rules, instance limits — gets you operational, but configuration drifts out of alignment as workloads evolve, traffic patterns shift, and application behavior changes.
A few principles to carry forward:
- Set wide gaps between scale-out and scale-in thresholds to prevent threshold flapping
- Define hard minimum and maximum instance count limits before going to production
- Load-test your scaling rules before trusting them under real traffic
- Revisit thresholds regularly as workload patterns change
And when you audit costs, look beyond compute. The storage attached to your autoscaling VMs can keep accruing charges long after those instances are gone — orphaned disks are a quiet but consistent budget leak. Tools like Lucidity can detect and flag idle or unattached disks automatically, so that spending doesn't go unnoticed.
Frequently Asked Questions
What is the difference between horizontal and vertical scaling in Azure?
Horizontal scaling (scale-out/in) adds or removes VM instances, enabling zero-downtime elasticity. Vertical scaling (scale-up/down) resizes a single VM's CPU or RAM, which typically requires a reboot. Because of the reboot requirement, vertical scaling is not a viable real-time autoscaling mechanism.
How does Azure Monitor fit into autoscaling?
Azure Monitor continuously collects metrics from Azure resources and evaluates them against threshold rules defined in autoscale profiles. When a threshold is breached, the autoscale engine provisions or deallocates instances. It evaluates rules every 30–60 seconds depending on resource type.
Can Azure autoscaling use custom application metrics instead of just CPU or memory?
Yes. Teams can use Application Insights to send application-level signals — response time, request rate, queue length — as scaling triggers. Azure Diagnostics Extension adds in-guest OS metrics for more granular signals, so scaling decisions reflect actual application behavior instead of relying on CPU or memory averages alone.
What is a cooldown period and why does it matter?
The cooldown period is a delay between scaling actions that prevents the autoscaler from re-evaluating rules immediately after a scale event. Without it, minor metric fluctuations can trigger rapid consecutive instance additions and removals — called flapping — degrading performance and inflating costs.
Do Azure Functions need autoscale rules configured?
No — Azure Functions on Consumption and Premium plans scale automatically based on event triggers without any autoscale rule configuration. Only Functions running on a Dedicated (App Service) plan require explicit autoscale rules to scale beyond fixed plan capacity.
How many autoscale rules can a VMSS profile have?
Azure supports up to 10 rules per autoscale profile and 20 profiles per autoscale setting. Within a profile, scale-out fires if any single rule condition is met, but scale-in requires all scale-in conditions to be met simultaneously. Factor this asymmetry into multi-rule profile design.