Introduction
Managing Azure costs is two separate problems that most teams treat as one. The first is visibility: understanding what you're spending right now. The second is forecasting: predicting what you'll spend next quarter. Both disciplines require different tools and different processes. Without both working together, budget overruns are a matter of when, not if.
Azure's pay-per-use model makes this harder than it looks. Elastic scaling means resources spin up fast, but cost accountability lags. Flexera's 2026 State of the Cloud report puts estimated wasted cloud spend at 29% of total IaaS and PaaS spend — a figure that reversed a five-year downward trend.
Whether you're standing up a FinOps practice from scratch or comparing tools like Cloudability against more automated alternatives, this guide gives you a clear framework. Here's what it covers:
- A practical Azure cost forecasting process you can implement today
- Native Azure Cost Management tools and how to use them effectively
- Third-party platforms worth evaluating as your needs scale
Key Takeaways
- Azure waste averages 29% of IaaS/PaaS spend — forecasting discipline is what separates proactive planning from billing surprises
- Start forecasting with Azure Cost Analysis: Daily Costs view, filter anomalies, read the projected cost line
- Native tools (Cost Management + Billing, Advisor, Pricing Calculator) cover the fundamentals at no extra cost
- Third-party platforms split into two categories: finance-led visibility tools and engineering-led automation tools
- Storage waste (unattached, unmounted, reserved, and zero-I/O disks) is consistently under-monitored and needs dedicated tooling to catch
Why Azure Cost Forecasting and Management Matter
Azure's billing model is elastic by design — that elasticity is the point. But it also means teams provision resources for peak demand, forget to downscale, and quietly compound waste across dozens of services over months.
The Gartner report on public cloud storage costs identifies overprovisioning, poor data lifecycle management, and outdated manual controls as the primary drivers of rising cloud storage costs. The pattern applies well beyond storage.
Without forecasting, two failures repeat on a quarterly cycle:
- Budget surprises mid-quarter — finance gets an unexpected cloud invoice and engineering gets blamed
- Justification gaps with leadership — no model exists to explain whether spend is tracking against plan or running hot
Effective forecasting converts reactive billing reviews into proactive planning conversations. Finance gets a number to hold engineering accountable to; engineering gets a defensible method for explaining variance. That's the operational shift that distinguishes teams with mature FinOps practices from those still chasing invoices after the fact.
How to Forecast Azure Costs: A Practical Approach
Start With Pricing Model Clarity
Before forecasting, you need to understand what Azure is actually charging you for — and which cost view you're reading.
- Pay-as-you-go costs are straightforward but offer no discount
- Reservations and Savings Plans appear as upfront or amortized charges depending on your view
- Amortized cost view spreads reservation costs across the commitment period — better for forecasting
- Actual cost view shows charges when they hit — better for reconciling invoices
Mixing these views produces inconsistent forecasts. Pick one and stay consistent across your team.
Build Your Baseline in Azure Cost Analysis
The native forecasting process in Azure Cost Analysis follows a repeatable pattern:
- Set granularity to Daily — this reveals trend lines that monthly aggregates hide
- Set the lookback window equal to the forward period you want to forecast (forecasting 90 days? look back 90 days)
- Filter out noise — use the Charge type filter to exclude Purchases, remove deleted resources, and strip out anomalous spikes
- Read the projected cost line — Azure displays forecast as a shaded extension of the area chart based on historical usage patterns
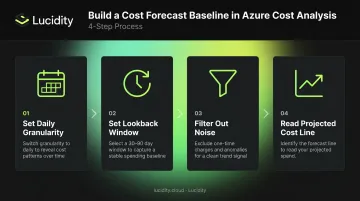
The projected line is only as clean as your filtered baseline. Unfiltered views distort the forecast significantly — which is why anomalies and planned changes need to be handled outside the baseline entirely.
Handle Anomalies and Planned Changes Separately
The filtered baseline captures your steady-state trajectory. But it misses two things:
- Workloads you deliberately removed (and filtered out)
- New workloads that don't exist in historical data yet
For each planned addition or migration, use the Azure Pricing Calculator to estimate the delta. Then manually add that estimate back into your projection. Repeat this process per subscription scope until your projection covers the full environment.
Operationalize Forecasting as a Practice
Forecasting only delivers value when it runs on a consistent cadence — here's what that looks like in practice:
- Create budgets in Azure Cost Management with alerts for both actual and forecasted spend thresholds
- Save filtered Cost Analysis views so your team loads the same baseline every time
- Subscribe to scheduled alerts to push cost trend charts to stakeholders monthly
Advanced Forecasting for Mature Teams
Teams at FinOps "Run" maturity — where the FinOps Foundation sets a benchmark of 12% maximum forecast variance — typically go beyond native tools. Most reach this stage after 6–12 months of consistent cost tracking. The pattern:
- Export cost data to Azure Storage on a recurring schedule
- Ingest into Power BI or a data warehouse for longer-horizon analysis
- Apply Azure AutoML time-series forecasting to detect variance patterns automatically
- Build KPI dashboards tracking forecast accuracy alongside actual spend
Start with the native tools. Add this layer once your team has a reliable baseline and the bandwidth to maintain it.
Azure Native Cost Management and Forecasting Tools
Microsoft's native toolset covers visibility, budgeting, and forecasting with no additional licensing cost. For most teams, it's the logical first stop — zero added cost, native integration, and no third-party dependencies.
Azure Cost Management + Billing
This is the system of record for Azure spend. Key capabilities:
- Cost Analysis views with daily, monthly, and accumulated granularity
- Budget creation with threshold-based alerts for actual and forecast spend
- Scheduled exports to Azure Storage for downstream analytics
- REST APIs for Power BI and internal tooling integration
It works best when resource tagging (owner, environment, cost center) and a clear management group/subscription hierarchy are in place. Without consistent tagging, cost attribution becomes guesswork.
Note: The AWS connector for cross-cloud visibility in Azure Cost Management was retired on March 31, 2025. Multi-cloud teams need a third-party solution for unified spend views.
Azure Advisor
Azure Advisor analyzes resource usage telemetry and generates ranked cost recommendations, including:
- Rightsizing oversized VMs and VM Scale Sets
- Deleting disks not attached to a VM
- Purchasing Reservations or Savings Plans based on usage patterns
It's the fastest path to actionable reductions without additional tooling. The gap: Advisor surfaces recommendations but doesn't implement them. Acting on each one still requires manual review, prioritization, and execution by your team.
Azure Pricing Calculator and Azure Migrate
The Azure Pricing Calculator is a pre-deployment planning tool for estimating new workload costs and comparing pricing models — pay-as-you-go vs. Reservations vs. Savings Plans vs. Azure Hybrid Benefit. Use it to model the financial impact of architectural decisions before you commit.
Azure Migrate extends this to migration scenarios. It builds a business case for moving on-premises workloads to Azure, covering:
- Total cost of ownership estimates for existing on-prem infrastructure
- Projected Azure costs post-migration by workload
- Potential savings from Azure Hybrid Benefit on Windows Server and SQL Server licenses
Top Third-Party Platforms for Azure Cost Management
Native tools cover the fundamentals but have real gaps: multi-cloud normalization, deep Kubernetes attribution, automated commitment management, and storage-level optimization. Third-party platforms fill these gaps with varying depth depending on their category.
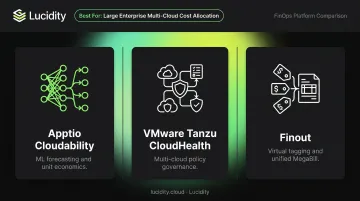
FinOps and Finance-Led Platforms
Best suited for large enterprises needing multi-cloud cost allocation, chargeback/showback reporting, and executive-ready dashboards.
| Platform | Core Strength |
|---|---|
| Apptio Cloudability | ML-based intelligent forecasting, unit economics views, budget and anomaly alerts |
| VMware Tanzu CloudHealth | Multi-cloud policy governance, compliance reporting |
| Finout | Virtual tagging layer, unified MegaBill across Azure, AWS, and GCP without code changes |
These platforms operationalize financial management at scale. Their limitation: they rely on engineering action to close the optimization loop.
Engineering-Led and Automation-Focused Platforms
Built for continuous optimization rather than visibility. These tools act on recommendations rather than just surfacing them.
- nOps — automated commitment laddering for Azure Reservations and Savings Plans, continuous rebalancing as usage shifts
- ProsperOps — autonomous Azure commitment lifecycle management, reduces both coverage gaps and overcommitment risk
- CAST AI — Kubernetes/AKS-specific optimization, predictive scaling, continuous workload rightsizing via agentless AKS integration
- Harness Cloud Cost Management — policy-as-code for tagging enforcement, AutoStopping for idle non-production resources
Specialized Storage Cost Optimization
General-purpose FinOps tools provide limited visibility into block storage waste. Yet unattached, unmounted, reserved, and zero-I/O disks are a consistent and invisible source of Azure overspend — Gartner specifically identifies overprovisioning as a leading driver of rising cloud storage costs.
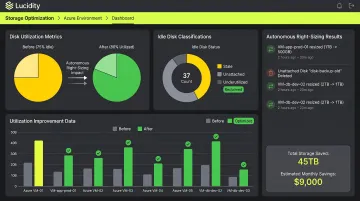
Lucidity is a purpose-built autonomous block storage optimization platform for Azure (and AWS and GCP) that addresses this gap directly. Where Azure Advisor flags unattached disks as a single category, Lucidity's Lumen product goes further — identifying all four idle disk types, surfacing disks that don't appear in native dashboards, and providing disk age, attachment state, and usage history so teams can act on evidence rather than guesses.
Beyond detection, Lucidity's core capabilities include:
- AutoScaler: Continuously right-sizes storage volumes without downtime, expanding and shrinking disks autonomously as workloads shift
- Tiering recommendations: Surfaces evidence-backed tier changes (such as Premium SSD to Standard SSD) where actual IOPS and throughput don't justify the higher cost
- Idle disk prioritization: Classifies and ranks all four idle disk types so engineering teams address the highest-waste items first
Average disk utilization across enterprises sits around 30%; Lucidity customers typically reach 75% post-deployment. For teams where storage waste accumulates between review cycles, that shift in utilization translates directly to sustained cost reduction.
Lucidity also offers a free, agentless Assessment tool that scans your Azure environment in under five minutes — no installs, no infrastructure changes — and surfaces utilization metrics, waste estimates, and downtime risks not visible in Azure's native tools.
Key Features to Evaluate in Any Azure Cost Management Tool
When evaluating tools, check for these capabilities:
- Forecasting with confidence intervals at the service, team, and region level — not just a single projection line
- Budget enforcement with alerts that trigger workflows (Slack, ticketing, CI/CD)
- Tagging governance that blocks deployments missing required tags at the policy layer
- Waste detection covering idle VMs, unattached disks, orphaned snapshots, and zombie IPs
- Toolchain integrations with CI/CD pipelines, Slack/Teams, and ITSM systems to sustain optimization through automation
Data Granularity and Attribution
Subscription and tag hierarchies aren't enough once FinOps needs to scale beyond the infrastructure team. Look for tools that support:
- Kubernetes namespace and pod-level cost attribution
- Mapping spend to business constructs — teams, products, or customers
- Cost allocation that survives tagging gaps and shared resource splits
Multi-Cloud Normalization
According to Flexera's 2024 State of the Cloud report, 89% of organizations use multi-cloud. If your organization runs AWS or GCP alongside Azure, tools must normalize spend across providers into a single view with consistent categorization. Without this, finance teams and engineering leads are reconciling different cost numbers — and neither side trusts the other's data.
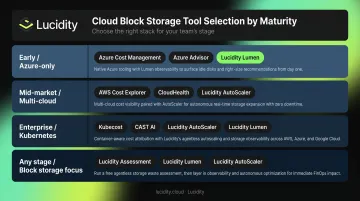
How to Choose the Right Azure Cost Management Tool
A Maturity-Based Selection Framework
| Stage | Recommended Stack |
|---|---|
| Early / Azure-only | Azure Cost Management + Billing, Azure Advisor, scheduled exports to Azure Storage |
| Mid-market / multi-cloud | Add a FinOps platform (Cloudability or Finout) for chargeback, multi-cloud forecasting, and executive reporting |
| Enterprise / Kubernetes or high commitment volume | Add nOps or CAST AI for automated commitment management or AKS-specific optimization |
| Any stage with significant block storage | Add Lucidity for autonomous storage right-sizing and idle disk remediation |
Automation-First vs. Reporting-First
Reporting tools require humans to close the optimization loop. If your team consistently acts on recommendations within a weekly or biweekly review cycle, that's sufficient.
When that review cadence breaks down, the costs show up fast. Consider moving to an automation-first platform if:
- Storage or compute waste recurs between review cycles despite prior action
- Commitment coverage drifts without anyone actively managing it
- Your team doesn't have bandwidth to act on recommendations consistently
An automation-first platform continuously executes changes, reducing waste without requiring manual intervention each cycle.
Single-Cloud vs. Multi-Cloud Depth
- Azure-only teams should prioritize depth: native pricing model understanding, Reservation and Savings Plan optimization, and tight integration with Azure policies
- Multi-cloud teams should prioritize breadth: normalized spend views, consistent anomaly detection across providers, and unified unit economics that leadership can read without toggling between portals
Frequently Asked Questions
What are the cost management tools for Azure?
Azure ships three native tools at no cost: Cost Management + Billing, Azure Advisor, and the Pricing Calculator. Third-party platforms split into FinOps/finance-led tools (Cloudability, CloudHealth, Finout) and engineering-led automation tools (nOps, CAST AI, Harness). Most mature organizations combine native tools with at least one third-party platform.
How do I estimate or forecast Azure costs?
Use the Daily Costs view in Azure Cost Analysis — set the lookback window to match your forecast horizon and filter out anomalies and one-time purchases. For planned migrations or new workloads, use the Azure Pricing Calculator to estimate the delta and fold it into your projection.
Is Azure Cost Management + Billing free to use?
Yes — it's included with Azure at no additional charge for Azure resources. Note that the AWS connector for cross-cloud visibility was retired on March 31, 2025, so multi-cloud visibility now requires a third-party platform. Azure Advisor is also included at no extra cost.
What is the difference between Azure Cost Management and Azure Advisor?
Azure Cost Management handles visibility, budgeting, and forecasting — the "what are we spending" layer. Azure Advisor generates specific, actionable recommendations for rightsizing, shutting down idle resources, and purchasing commitments — the "what should we do about it" layer. They work best together.
When should I move beyond Azure native tools to a third-party platform?
The clear signals: you need multi-cloud spend normalization, deep Kubernetes cost attribution at the namespace or pod level, automated commitment management, or business-level cost allocation (cost per customer, product, or feature) that requires more than manual tag filtering.
How can I reduce Azure storage costs?
Start by hunting down storage waste: unattached disks, unmounted volumes, reserved storage with zero I/O, and orphaned snapshots. These rarely surface in native dashboards. Tools like Lucidity's Lumen continuously detect and right-size these resources without infrastructure changes, covering a cost category most FinOps reviews miss.