Introduction
Your Azure bill arrives and it's 35% higher than last month. No incident was flagged, no deployment failed — yet something shifted weeks ago and costs kept climbing until the invoice made it impossible to ignore.
According to Flexera's 2025 State of the Cloud Report, 84% of organizations struggle to manage cloud spend — and a core reason is that cost monitoring is retrospective by default, not proactive.
This article covers:
- What Azure cost anomaly detection is and how the native model works
- Where the built-in tooling falls short
- What causes most anomalies in the first place
- How to build a response workflow that shrinks the gap between "spike occurs" and "team acts"
Key Takeaways
- Azure cost anomaly detection uses a WaveNet-based ML model trained on 60 days of history, though alerts arrive with a 1–2 day delay after each UTC day closes
- Native budget alerts and anomaly detection serve different purposes; both are needed together
- The most common causes are uncapped autoscaling, log ingestion spikes, storage misconfigurations, and human error
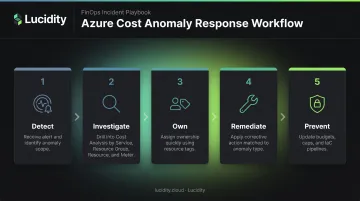
- Five-stage response framework — Detect → Investigate → Own → Remediate → Prevent — keeps anomalies from recurring
- Storage-specific waste (unattached, idle, over-provisioned disks) often evades standard anomaly detection entirely
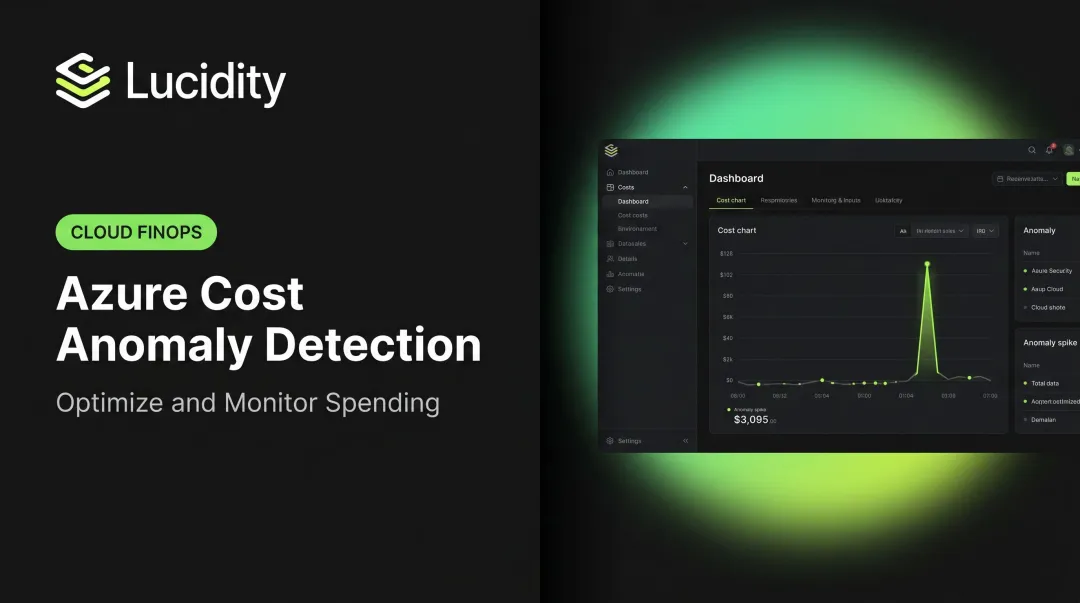
What Is Azure Cost Anomaly Detection?
Azure cost anomaly detection is an automated capability inside Azure Cost Management that analyzes daily spending patterns and flags deviations outside an expected range — without requiring users to manually define thresholds. The system learns from historical behavior and surfaces unexpected changes within its detection window.
Anomaly Detection vs. Budget Alerts
These two tools are frequently confused, but they answer different questions:
| Feature | Budget Alerts | Anomaly Detection |
|---|---|---|
| Trigger | Spend crosses a threshold you define (e.g., 80% of monthly budget) | Spend deviates unexpectedly from learned patterns |
| Configuration | Manual threshold required | Automatic — no threshold needed |
| Use case | Hard spending guardrails | Detecting unusual behavior early |
| Limitation | Won't fire if spend is unusual but still under budget | Won't fire for predictable increases |
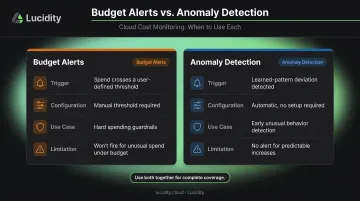
A budget alert won't catch gradual cost creep that stays under your ceiling — anomaly detection will. Running them together gives you a behavioral signal and a financial backstop. That combination matters most when you consider how quickly the detection window actually closes.
What "Near Real Time" Actually Means in Azure
Microsoft's documentation confirms that Azure Cost Management anomaly detection runs 36 hours after the end of each UTC day to ensure a complete data set. This creates a 1–2 day detection lag by design.
True near-real-time detection requires supplementing the native model with:
- Granular budget alerts at 80%, 100%, and 120% of subscription spend — these fire near-immediately
- Cost Management API polling, though Microsoft caps recommended frequency at once per day
- Third-party FinOps platforms that ingest and analyze billing data on sub-daily cycles
How Azure Cost Anomaly Detection Works
Azure's anomaly detection pipeline runs across three layers: data ingestion, an ML-based detection model, and alert delivery. Each layer has distinct behavior — and distinct limitations that shape how much you can rely on native signals alone.
Ingestion: Where the Data Comes From
Azure Cost Management pulls spending data from the Cost Management and Billing APIs at the subscription, resource group, and resource level. Cost Management data refreshes every 4 hours as new usage data arrives from Azure resource providers, though the anomaly detection model itself only processes once the full UTC day is complete.
Daily granularity is the default. Enabling resource-level billing exports improves baseline fidelity over time but won't accelerate the native detection cadence.
The Detection Model
Microsoft documents a WaveNet-based deep learning model trained on the previous 60 days of usage patterns. The model:
- Forecasts expected spend for each current day
- Flags actual spend that falls outside a confidence interval
- Accounts for trends, weekday/weekend cycles, and recurring billing events to reduce false positives
New subscriptions with less than 60 days of history will produce less reliable signals — accuracy improves as the baseline matures.
That 60-day dependency is a real constraint for newer environments. Three complementary approaches cover what the native model can't:
Detection Techniques Beyond the Native Model
- Threshold-based budget alerts — Set at 80%, 100%, and 120% of monthly spend per subscription; these fire near-immediately when thresholds are crossed
- Time-series models in third-party tools — Build rolling baselines per service, tag, region, or Kubernetes namespace for finer-grained detection
- Unit cost monitoring — Track derived metrics like cost per VM-hour or cost per transaction; sudden shifts in unit economics often precede invoice-level anomalies
Once the model flags an anomaly, the delivery mechanism determines how fast your team can act on it.
Surfacing and Alerting
Detected anomalies appear in two places:
- Azure portal — Cost Analysis smart views show anomaly indicators inline in the Resources view, including deleted resources
- Anomaly alert emails — Include the anomalous amount, expected range, affected scope, service breakdown, and a direct portal link
One current limitation: native alerts are email-only. Routing to Teams or Slack requires a Logic Apps or Azure Functions integration.
The Most Common Causes of Azure Cost Anomalies
Anomalies aren't random. They follow predictable patterns tied to specific resource behaviors, and knowing the categories helps teams set preventive guardrails before the next spike.
Compute Runaway
Azure VMSS and App Service autoscale rules without a defined maximum instance limit can multiply compute costs within hours. When demand spikes, uncapped scaling rules respond exactly as configured. The problem is the configuration.
Spot VM fallbacks compound this. Azure Spot VMs can be evicted when Azure needs capacity; if max price is set to -1 (no price-based eviction), a capacity event forces workloads onto on-demand pricing at a steep cost increase.
Preventive fix: Define maximum instance counts on every autoscale rule in production, without exception.
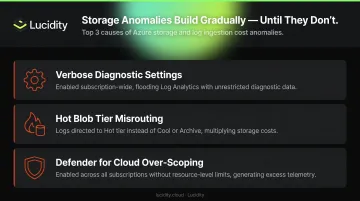
Storage and Log Ingestion Explosions
Unexpected data ingestion into Azure Monitor Log Analytics is one of the most common non-compute anomaly sources. Microsoft's own usage-analysis guidance includes a sample alert for billable ingestion volumes exceeding 50 GB in 24 hours: a clear signal that a verbosity or scoping issue has occurred.
Common triggers include:
- Verbose diagnostic settings enabled subscription-wide
- Logs directed to Hot blob tier instead of Cool or Archive
- Defender for Cloud enabled across all subscriptions without resource-level scoping (Defender for Servers Plan 2 includes 500 MB of free daily ingestion per node; beyond that, charges accumulate)
Storage anomalies are particularly difficult to catch because they accumulate gradually before appearing as a large line item.
Networking and Pipeline Events
Egress costs can spike from:
- Accidental cross-region data replication
- Misconfigured Azure CDN or Front Door routing
- Uncompressed data exports from Synapse Analytics or Data Factory
- API Management without throttling policies, which passes unbounded traffic to backend compute and amplifies cost across multiple services simultaneously
Human Error and Configuration Drift
The FinOps Foundation recognizes misconfiguration as a documented anomaly cause category, and it's the hardest for ML models to catch. A wrong-region deployment, a forgotten proof-of-concept VM, or a partial IaC pipeline re-deployment that leaves duplicate resources running can look like a legitimate new workload rather than a deviation. The behavioral signature of an accidental deployment is nearly identical to a real one — without additional context, no model can tell the difference.
Building an Azure Cost Anomaly Response Workflow
Detection without a response process generates awareness, not action. The FinOps Foundation defines Anomaly Management as the ability to detect, identify, clarify, alert on, and manage unexpected cost events in a timely manner — the "manage" step is what most teams skip.
The five-stage workflow below closes that gap.
Stage 1 – Detect and Triage
When the anomaly email or Teams notification arrives, it includes the affected scope, the anomalous amount vs. expected range, and a portal link.
The first decision is binary: expected or unexpected?
- Document and close if it's an expected event (known deployment, seasonal traffic, reserved instance purchase) — log it proactively before the alert fires to prevent wasted investigation cycles
- Escalate to Stage 2 immediately if the cause is unknown
Stage 2 – Investigate the Source
Work through Cost Analysis layer by layer:
- Start at the anomalous day in Cost Analysis
- Group costs by Service → Resource Group → Resource → Meter
- Cross-reference with the Azure Activity Log to identify what changed and when
The Activity Log records control-plane operations and events are typically available within 3 to 20 minutes, retained for 90 days. Use the CLI to filter:
az monitor activity-log list \
  --resource-group <rg-name> \
  --start-time <YYYY-MM-DDTHH:MM:SSZ> \
  --end-time <YYYY-MM-DDTHH:MM:SSZ>
Stage 3 – Identify Ownership and Remediate
Resource tagging is what makes the "whose resource is this?" question take minutes instead of hours. Without consistent tags, ownership investigation stalls at this stage.
Corrective actions by anomaly type:
- Accidental deployment: delete or deallocate the resource
- Misconfiguration: revert to the previous state and document the change
- Runaway autoscale: cap maximum instance counts immediately
- Log verbosity: adjust diagnostic settings and scope Defender configurations to specific resources
- Suspected unauthorized creation: escalate to the security team before remediating
Stage 4 – Automate and Prevent
After resolution, close the loop with automation to reduce future response time:
- Logic Apps monitoring the anomaly alert mailbox to parse emails and create Jira or ServiceNow tickets automatically
- Azure Functions querying the Cost Management API on a custom schedule and posting to Teams or Slack
- Microsoft Sentinel for organizations that want cost anomaly management alongside operational incident workflows
Prevention is where the fix pays dividends. Once the incident is closed:
- Update budget alert thresholds to reflect the new baseline
- Add autoscale caps to prevent recurrence
- Adjust log verbosity settings that contributed to the spike
- Implement IaC cleanup pipelines to catch orphaned resources before they accumulate spend
How Lucidity Helps Prevent Storage-Driven Azure Cost Anomalies
Storage anomalies occupy a frustrating category: they accumulate gradually, don't trigger the sudden spikes that autoscaling catches, and often evade standard anomaly detection models until the bill arrives. Microsoft acknowledges that unattached managed disks represent real cost in a subscription — but native Azure tools surface this inconsistently.
Lucidity's own data shows organizations average over 50% storage underutilization, pointing to an estimated $21.5 billion in wasted cloud block storage spend by 2028 across cloud environments. For FinOps teams managing Azure cost anomalies, storage waste is a persistent blind spot.
What Lucidity's Lumen Identifies That Azure Cost Management Misses
Lucidity Lumen uniquely identifies and prioritizes **four categories of idle disks** that don't consistently appear in native Azure dashboards or Azure Advisor recommendations:
- Unattached disks — provisioned and billed but not connected to any VM
- Reserved disks — allocated capacity sitting unused within a provisioned volume
- Unmounted disks — attached to a VM but not mounted by the OS, contributing zero value
- Zero-I/O disks — mounted and visible, but with no read/write activity in the past 30 days
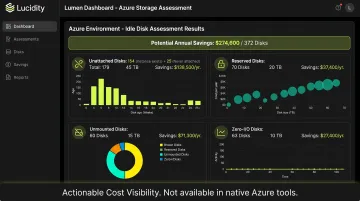
Together, these four categories can represent up to 70% of unused block storage spend. Because the waste accumulates at the disk level rather than generating a sudden spike, standard cost anomaly detection models tend to miss it until it's already a material budget problem.
Autonomous Prevention, Not Just Detection
Lucidity acts on storage waste before it registers as an anomaly. The AutoScaler continuously right-sizes Azure Managed Disks: expanding in real time as workloads grow, shrinking autonomously to reclaim unused capacity. No downtime. No infrastructure changes required.
For idle disk cleanup, Lumen provides one-click removal that is safe, auditable, and reversible — no scripts required. The results are measurable: Dometic reduced cloud storage spend by 52% after deployment, and Fortune 500 enterprises across Lucidity's customer base are achieving up to 70% savings on block storage costs.
For FinOps teams assessing their Azure storage exposure, Lucidity's free Assessment tool returns actionable results in under 5 minutes — agentless, with no permissions setup or infrastructure changes required.
Frequently Asked Questions
Is Azure Cost Management cost analysis accurate?
Azure Cost Management is generally accurate for reporting actual spend. Anomaly detection accuracy depends on historical data depth — new subscriptions with limited history produce less reliable signals. Accuracy improves after several weeks of consistent data ingestion as the 60-day training baseline matures.
How does Azure Cost Management anomaly detection evaluate spending patterns?
It uses a WaveNet-based deep learning model trained on 60 days of historical spending to forecast expected daily costs, then flags actual spend that deviates outside a confidence interval. The Azure AI Anomaly Detector API is a separate, general-purpose time-series service that can be layered on top for custom detection cadences.
What is the detection delay for Azure Cost Management anomaly alerts?
Native anomaly detection runs approximately 36 hours after the end of each UTC day to ensure a complete data set, resulting in a 1–2 day detection lag. Near-real-time detection requires supplementary approaches: granular budget alerts, API polling, or third-party FinOps platforms.
What are the most common causes of Azure cost anomalies?
Four categories account for most incidents:
- Uncapped autoscaling — compute runaway with no ceiling defined
- Excessive data ingestion — log or diagnostic data flooding Azure Monitor
- Networking egress — misconfigured replication or CDN routing
- Human error — wrong-region deployments or forgotten proof-of-concept resources
How is Azure cost anomaly detection different from budget alerts?
Budget alerts fire when spend crosses a threshold you define. Anomaly alerts fire when spend deviates unexpectedly from learned historical patterns — regardless of whether a budget ceiling is approached. Both serve different purposes and work best together.
Can Azure anomaly alerts be configured across multiple subscriptions?
Native Azure anomaly alerts are scoped to the subscription level, requiring separate alert rules per subscription. For enterprise-wide monitoring in a single view, teams typically combine Azure Cost Management at the management group level with a third-party FinOps platform.