The frustrating part: latency isn't always a sign that something is broken. Azure Monitor introduces deliberate buffering and processing delays at multiple pipeline stages. The trouble starts when those delays exceed expected thresholds, become inconsistent, or silently break alerting rules that teams assume are working correctly.
This guide covers what normal latency looks like across different data types, how to pinpoint the source of excessive delay using KQL, and how to fix it — with the right solution matched to the right root cause.
Key Takeaways
- Azure Monitor latency = the delay between when an event occurs and when it's queryable in Log Analytics
- Normal ranges: under 10 seconds for pipeline processing, up to 20 minutes for activity logs
- Common causes: agent batching, network path issues, workspace throughput limits, and ingestion-time DCR transformations
- Diagnose using three timestamps:
TimeGenerated,_TimeReceived, andingestion_time()— each targets a different pipeline stage - Fixes are cause-specific: tune DCR intervals, optimize transformations, or adjust workspace SKU and alert look-back windows
- Prevention requires ongoing ingestion health monitoring — not a one-time configuration change
What Is Azure Monitor Latency?
Azure Monitor latency is the total elapsed time from when an event occurs on a monitored resource to when that data becomes queryable in Log Analytics or visible in Azure Monitor Metrics. It has two distinct segments:
- Client-side latency — from the monitored resource to the Azure Monitor data collection endpoint (agent buffering, network transit)
- Azure-side latency — from endpoint receipt through parsing, indexing, and storage until the record is queryable
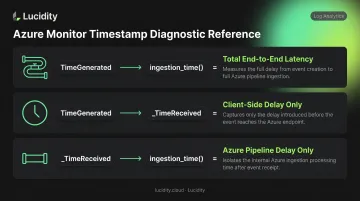
The Three Timestamps You Need to Know
Diagnosing latency accurately requires comparing three specific fields, not just one:
| Timestamp | What It Represents |
|---|---|
TimeGenerated |
When the event was created at the source |
_TimeReceived |
When the record arrived at Azure Monitor's ingestion endpoint |
ingestion_time() |
When the record became queryable in the workspace |
Each pair of fields answers a different diagnostic question:
TimeGenerated→ingestion_time(): total end-to-end latencyTimeGenerated→_TimeReceived: client-side delay only_TimeReceived→ingestion_time(): Azure pipeline delay only
Start with the end-to-end gap, then narrow down using the other two fields to pinpoint where the delay is occurring.
Expected Latency Benchmarks
According to Microsoft's latency documentation, these are the documented normal ranges by data type:
| Data Type | Expected Latency |
|---|---|
| Azure Monitor pipeline processing | Under 10 seconds (average) |
| Azure Monitor Agent upload | 30 seconds to 2 minutes |
| Platform metrics (metrics database) | Under 1 minute |
| Platform metrics export via DCR | ~3 minutes |
| Resource logs | 3–10 minutes end-to-end |
| Activity logs | 3–20 minutes |
These are documented guidance ranges, not formal SLA guarantees. Treat them as baselines for identifying anomalies, not contractual thresholds.
Common Causes of Azure Monitor Latency
Most latency issues follow predictable patterns tied to specific pipeline stages. The five causes below cover the vast majority of cases — knowing which applies to your environment determines where to focus the fix.
Agent and Batching Delays
AMA buffers logs before uploading — typically every 30 seconds to 2 minutes. But different data types have different collection behaviors that compound this:
- Windows events and Syslog: Collected immediately on occurrence
- Linux performance counters: Polled every 30 seconds
- Text logs and IIS logs: Read every 5 minutes, only after the file's timestamp changes
A syslog forwarder configured with a 5-minute batch interval adds that delay directly to observed latency. Source-side batching is easy to overlook and often the actual culprit.
Network Bottlenecks
Network path quality between the agent and the Azure Monitor data collection endpoint contributes variability rather than consistent delay. QoS policies that deprioritize log traffic, high-latency cross-region routes, or intermittent packet loss are the usual culprits. All three show up as elevated AgentLatency in KQL — specifically, a widening gap between _TimeReceived and TimeGenerated.
Workspace Throughput Limits
Microsoft documents a default workspace ingestion rate threshold of 500 MB/min compressed (approximately 6 GB/min uncompressed). When a volume spike hits — say, a security event floods logs from hundreds of hosts simultaneously — data queues and ingests at a slower rate. The symptom is sustained latency during peak windows that returns to normal off-peak.
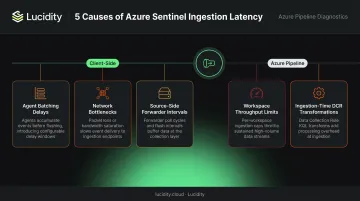
Ingestion-Time Transformations
DCRs with KQL transformation queries add processing overhead to every record they touch. Complex transformations on high-volume tables introduce measurable latency. The Logs Transformation Duration per Min metric in Azure Monitor is the built-in tool for quantifying this overhead.
Indexing Lag
An easy-to-miss cause: data can be stored in the workspace (confirmed by _IngestionTime) but not yet fully indexed, making it temporarily invisible to queries. This is most common during ingestion surges. If records appear in _IngestionTime but don't surface in query results, indexing lag is the likely explanation — not data loss.
How to Diagnose Azure Monitor Latency
Effective diagnosis means isolating which pipeline stage is responsible before attempting any fix. KQL is the primary tool throughout this process.
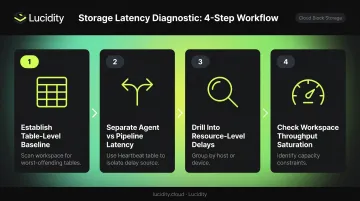
Step 1: Establish a Table-Level Latency Baseline
Start with a workspace-wide scan to find the worst-offending tables:
union withsource=TableName *
| extend IngestionLatencyMinutes = datetime_diff('minute', ingestion_time(), TimeGenerated)
| summarize AvgLatencyMin = avg(IngestionLatencyMinutes) by TableName
| order by AvgLatencyMin desc
This surfaces whether high latency is isolated to one table or widespread across the workspace. That distinction determines the entire direction of your investigation.
Step 2: Separate Agent Latency from Azure Pipeline Latency
The Heartbeat table provides Microsoft's documented approach for splitting total delay into its two components:
Heartbeat
| where TimeGenerated > ago(8h)
| extend E2EIngestionLatency = ingestion_time() - TimeGenerated
| extend AgentLatency = _TimeReceived - TimeGenerated
| summarize
    percentile(E2EIngestionLatency, 95),
    percentile(AgentLatency, 95)
    by Computer
Reading the results:
- High
AgentLatency→ problem is client-side (agent config, network, source batching) - High gap between
E2EIngestionLatencyandAgentLatency→ problem is in the Azure pipeline
Step 3: Drill Into Resource-Level Delays
Once you've identified a high-latency table, narrow to specific sources by adding a summarize grouping to your query:
- For
SecurityEvent: group byComputer - For
CommonSecurityLog: group byDeviceVendorandDeviceProduct
This isolates whether a single host, network appliance, or log source is pulling the table's average up — and points you directly at the source rather than the symptom.
Step 4: Check for Workspace Throughput Saturation
Use Log Analytics Workspace Insights and the Data Collection Health Monitoring Workbook in Azure Monitor or Sentinel to detect capacity constraints. The telltale pattern: latency spikes during high-ingestion windows and drops off-peak. This is workspace saturation, not an agent or network problem, and it requires a different fix entirely.
How to Fix Azure Monitor Latency Issues
Once you've traced latency to its source, the fix becomes straightforward. Applying a remedy to the wrong layer wastes time and can mask what's actually causing the delay.
Fix 1: Reduce Agent and Source-Side Delays
If your diagnostic work pointed to agent-side delays:
- Tune DCR collection intervals — for performance counters, reduce
samplingFrequencyInSecondsin the DCR schema to what's actually needed for alerting - Filter at ingestion time — use DCR transformations to collect only actionable data (for example, Syslog at
LOG_ERRand above rather than all severities) - Audit on-premises forwarders — verify that syslog forwarders and Windows Event Forwarder (WEF) subscriptions aren't configured with unnecessarily long batch intervals
- IIS logs — configure hourly log rollover instead of daily; Microsoft recommends this to avoid data spikes at rollover time
Fix 2: Address Network Latency
- Audit QoS policies on the network path to confirm log traffic isn't being deprioritized
- Verify the agent is connecting to the nearest regional Azure Monitor endpoint
- Check for DNS resolution delays before each upload cycle — these add up across thousands of upload events
Fix 3: Scale Workspace Capacity
For throughput saturation identified in Step 4:
- Upgrade from Pay-As-You-Go to a higher Commitment Tier (starting at 100 GB/day) or Dedicated Cluster SKU to raise the ingestion throughput ceiling
- For high-volume, low-priority logs where real-time querying isn't critical, route those tables to the Basic Logs or Auxiliary Logs plan — this frees capacity for high-priority streams without a full workspace upgrade
Fix 4: Optimize Ingestion-Time Transformations
Audit DCR transformation queries for:
- Row-by-row string operations on high-volume tables
- Filtering that could be applied at the source instead of in Azure
- Redundant parsing steps that duplicate work
Use the Logs Transformation Duration per Min metric before and after changes to confirm the optimization had the expected effect.
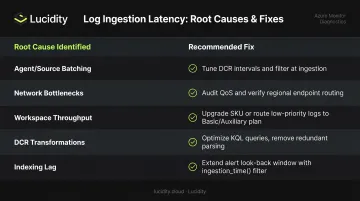
Fix 5: Adjust Alert Rules for Indexing Lag
Microsoft's recommended pattern for Sentinel analytics rules applies equally to Azure Monitor scheduled rules: extend the look-back window to cover maximum expected latency plus the rule interval. If typical ingestion delay is 2 minutes and the rule runs every 5 minutes, look back 7 minutes. Add an ingestion_time() filter to prevent duplicate alerts from the extended window:
| where ingestion_time() > ago(5m)
This prevents missed detections without creating alert storms from re-processing already-handled events.
Best Practices to Prevent Azure Monitor Latency
Reactive troubleshooting is expensive. Most persistent latency problems are preventable with consistent operational hygiene.
Ongoing preventive actions:
- Schedule regular latency reviews — run time-series KQL queries weekly to catch degradation before it affects alerting pipelines
- Optimize DCRs continuously — only collect what's actionable; prefer source-side filtering over post-ingestion transformation whenever possible
- Right-size workspaces proactively — base workspace tier decisions on projected ingestion volume growth, not on current consumption after hitting limits
- Document baselines per data type — when your team knows that resource logs normally arrive in 5 minutes, a 15-minute delay is immediately recognizable as anomalous
Monitor the pipeline itself as a first-class concern:
- Set metric alerts on
Ingestion Volumetrends to catch unexpected spikes before they cause sustained latency - Use the Data Collection Health Monitoring Workbook in Sentinel/Azure Monitor for a live view of ingestion health across subscriptions
- Review Log Analytics Workspace Insights regularly for usage, performance, and query health in one place
For teams managing Azure storage at scale, keep in mind that disk utilization data in Log Analytics always reflects the recent past. When that lag drives over-provisioning decisions, it carries a real cost. Lucidity's Lumen provides real-time Azure Managed Disk utilization visibility — identifying idle disks, tier mismatches, and utilization trends — as a complement to Azure Monitor's broader observability coverage.
Frequently Asked Questions
What is the latency of Azure Monitor ingestion?
End-to-end latency varies by data type: platform metrics are available in under a minute, resource logs typically arrive in 3–10 minutes, and activity logs can take 3–20 minutes. Azure Monitor's own pipeline processing averages under 10 seconds — the rest is source-side and network delay. Verify current figures against Microsoft's latency documentation before making SLA commitments.
Is Azure Monitor real time?
Near-real-time, not instantaneous. Data is collected, buffered, transmitted, processed, and indexed before it becomes queryable — each stage adds delay. Platform metrics are available within a minute, but log-based data carries higher latency depending on source type and pipeline load.
What is the difference between TimeGenerated and ingestion_time() in Azure Monitor?
TimeGenerated is when the event was created at the source. ingestion_time() is when the record became queryable in the Log Analytics workspace. The gap between them represents total end-to-end latency. The _TimeReceived field provides a middle point that separates client-side delay from Azure pipeline delay.
How do I measure Azure Monitor ingestion latency with KQL?
Calculate the difference between ingestion_time() and TimeGenerated. Use percentile aggregations — p50 and p95 — grouped by computer or data source to reveal both median performance and worst-case spikes. The Heartbeat table is the recommended starting point since it generates frequent, consistent records well-suited for latency baselining.
What causes high Azure Monitor log ingestion latency?
The four most common causes: agent batching intervals adding source-side delay, network path issues between the agent and the Azure endpoint, workspace throughput limits being hit during volume spikes, and complex ingestion-time KQL transformations applied via DCRs on high-volume tables.
Can Azure Monitor latency affect my alert rules?
Yes. Scheduled analytics rules using TimeGenerated-based windows can miss events generated within the window but ingested after it closed. Extend the look-back period to cover maximum expected latency plus the rule interval, then add an ingestion_time() filter to prevent duplicate detections.